2018年5月29日火曜日

Leaflet 1.3 - 4-8 Non-geographical maps

4-8 Non-geographical maps
A primer on L.CRS.Simple, how to make maps with no concept of “latitude” or “longitude”.

L.CRS.Simple 入門で、緯度と経度の概念のないマップを作成する方法です。


Not of this earth
この地球ではない

Sometimes, maps do not represent things on the surface of the earth and, as such, do not have a concept of geographical latitude and geographical longitude. Most times this refers to big scanned images, such as game maps.

ときには、マップは地球の表面上のものを要求しませんが、そのため、地理的な緯度と経度を持ちません。ほとんどの場合、これは、ゲームマップのような、大きなスキャン画像に関連します。

For this tutorial we’ve picked a starmap from Star Control II, a game that is now available as the open-source project The Ur-Quan Masters. These maps were made with a tool to read the open-source data files of the game, and look like this:

このチュートリアルのために、オープンソースプロジェクト The Ur-Quan Masters として現在利用できるゲーム、Star Control II から starmap を取り上げています。これらのマップは、ゲームのオープンソースデータファイルを読み込むツールで作成され、このように見えます:


(訳注:画像は、「Star Control」の 「starmaps(http://www.star-control.com/starmaps.php)」の「Name」の「07」を加工し使用します。)


The game has a built-in square coordinate system, as can be seen in the corners. This will allow us to establish a coordinate system.

ゲームは、角に見られるように、組み込み正方形座標システムがあります。これは座標システムを設置することを許可します。


CRS.Simple

CRS stands for coordinate reference system, a term used by geographers to explain what the coordinates mean in a coordinate vector. For example, [15, 60] represents a point in the Indian Ocean if using latitude-longitude on the earth, or the solar system Krueger-Z in our starmap.

coordinate reference system(座標参照系)を表す CRS、用語は、コーディネート(座標)はコーディネートベクタで意味することを説明するために地理学者によって使用されます。例えば、[15, 60] は、地球の緯度経度、または、starmap で solar system Krueger-Z を使用しているなら、インド洋にあるポイントを表します。

A Leaflet map has one CRS (and one CRS only), that can be changed when creating the map. For our game map we’ll use CRS.Simple, which represents a square grid:

Leaflet マップが一つの CRS (そして CRS ひとつだけ) 持っていますが、これはマップを作成するとき変えられます。ゲームマップのために、正方形グリッドを表す、CRS.Simple を使います:
var map = L.map('map', {
 crs: L.CRS.Simple
});
Then we can just add a L.ImageOverlay with the starmap image and its approximate bounds:

次に、starmap 画像とそのおおよその境界(bounds)で L.ImageOverlay をすぐ(下)に追加します。
var bounds = [[0,0], [1000,1000]];
var image = L.imageOverlay('uqm_map_full.png', bounds).addTo(map);
And show the whole map:

そして、マップ全体を表示します:
map.fitBounds(bounds);

This example doesn’t quite work, as we cannot see the whole map after doing a fitBounds().

この例はうまく動作しないので、fitBounds() を実行した後にマップ全体を見られません。


Common gotchas in CRS.Simple maps
CRS.Simple マップの一般的な了解事項

In the default Leaflet CRS, CRS.Earth, 360 degrees of longitude are mapped to 256 horizontal pixels (at zoom level 0) and approximately 170 degrees of latitude are mapped to 256 vertical pixels (at zoom level 0).

デフォルト Leaflet CRS、CRS.Earth、360度の経度は、(ズームレベル0で)256水平ピクセルにマップし、そして、おおよそ170度の緯度は、(ズームレベル0で)256垂直ピクセルにマップします。

In a CRS.Simple, one horizontal map unit is mapped to one horizontal pixel, and idem with vertical. This means that the whole map is about 1000x1000 pixels big and won’t fit in our HTML container. Luckily, we can set minZoom to values lower than zero:

CRS.Simple では、1水平マップ単位は1水平ピクセルでマップされ、垂直も同じです。これは、マップ全体はおよそ 1000x1000 ピクセルの大きさで、HTML コンテナにぴったり合いません。幸いに、minZoom を0以下に値を設定できます:
var map = L.map('map', {
 crs: L.CRS.Simple,
 minZoom: -5
});

Pixels vs. map units

One common mistake when using CRS.Simple is assuming that the map units equal image pixels. In this case, the map covers 1000x1000 units, but the image is 2315x2315 pixels big. Different cases will call for one pixel = one map unit, or 64 pixels = one map unit, or anything. Think in map units in a grid, and then add your layers (L.ImageOverlays, L.Markers and so on) accordingly.

CRS.Simple を使用するとき一つの一般的な間違いは、マップ単位が画像ピクセルと等しいと仮定することです。この場合、マップは 1000x1000 単位でカバーしますが、画像は 2315x2315 ピクセルの大きさです。別の場合は、1ピクセル=1マップユニット、または、64ピクセル=1マップ単位などです。1グリッド内でマップ単位を考え、それから、それに応じて(L.ImageOverlays、L.Markers などの)レイヤを追加します。

In fact, the image we’re using covers more than 1000 map units - there is a sizable margin. Measuring how many pixels there are between the 0 and 1000 coordinates, and extrapolating, we can have the right coordinate bounds for this image:

実際に、使用する画像は、1000 マップ単位以上をカバーし - 相当の大きさの余白があります。0 と 1000 座標の間に何ピクセルあるか測定し、そして推測し、この画像の右座標境界を持つことができます:

var bounds = [[-26.5,-25], [1021.5,1023]];
var image = L.imageOverlay('uqm_map_full.png', bounds).addTo(map);

(訳注:07.png を加工した画像は、3168x3168 ピクセルで、y軸の0から1000の間のピクセル数は2942です。

y 3062[y0]-120[y1000]=2942, 2942/1000=2.942

0から画像の下端までのピクセル数とy軸値は、

y0 3168-3062=104, 104/2.942=35.4

0から画像の上端までのピクセル数とy軸値は、

y1 3062/2.942=1040.8

y軸の0から1000の間のピクセル数も2942です。

x 3064[x1000]-122[x0]=2942, 2942/1000=2.942

0から画像の左端までのピクセル数とx軸値は、

x0 122/2.942=41.5

0から画像の右端までのピクセル数とx軸値は、

x1 3168-122=3046, 3046/2.942=1035.4

var bounds = [[-35.4,-41.5], [1040.8,1035.4]];


While we’re at it, let’s add some markers:

それをいじくる間、いくつかマーカを追加しましょう。
var sol = L.latLng([ 145, 175.2 ]);
L.marker(sol).addTo(map);
map.setView( [70, 120], 1);

This is not the LatLng you’re looking for
これはあなたが探している LatLng ではありません

You’ll notice that Sol is at coordinates [145,175] instead of [175,145], and the same happens with the map center. Coordinates in CRS.Simple take the form of [y, x] instead of [x, y], in the same way Leaflet uses [lat, lng] instead of [lng, lat].

Sol は、座標 [175,145] の替わりに [145,175] にあり、同じことはマップの中心(center)で起こります。CRS.Simple で座標は、[x, y] の替わりに [y, x] の形式をとり、同じように、Leaflet は、[lng, lat] の替わりに [lat, lng] を使います。

(In technical terms, Leaflet prefers to use [northing, easting] over [easting, northing] - the first coordinate in a coordinate pair points “north” and the second points “east”)

(専門用語では、[easting(東距), northing(北距)] に優先して [northing, easting] を使う方がよく、座標対で最初の座標は「北(北緯)」を示し、2番めは、「東(東経)」を示します。)

The debate about whether [lng, lat] or [lat, lng] or [y, x] or [x, y] is not new, and there is no clear consensus. This lack of consensus is why Leaflet has a class named L.LatLng instead of the more confusion-prone L.Coordinate.

[lng, lat] か [lat, lng]、または、 [y, x] か [x, y] についての論争は、新しいものではありません、そして、はっきりしたコンセンサスはありません。このコンセンサスの欠如は、Leaflet がより混乱傾向のある L.Coordinate の替わりに L.LatLng という名前のクラスがある理由です。

If working with [y, x] coordinates with something named L.LatLng doesn’t make much sense to you, you can easily create wrappers for them:

もし、L.LatLng という名前のもので [y, x] 座標で実行することが納得できないなら、それらのラッパーを簡単に作成できます:
var yx = L.latLng;

var xy = function(x, y) {
 if (L.Util.isArray(x)) {    // When doing xy([x, y]);
  return yx(x[1], x[0]);
 }
 return yx(y, x);  // When doing xy(x, y);
};
Now we can add a few stars and even a navigation line with [x, y] coordinates:

では、2、3個の星と [x, y] 座標のナビゲーションラインを追加します:
var sol      = xy(175.2, 145.0);
var mizar    = xy( 41.6, 130.1);
var kruegerZ = xy( 13.4,  56.5);
var deneb    = xy(218.7,   8.3);
L.marker(     sol).addTo(map).bindPopup(      'Sol');
L.marker(   mizar).addTo(map).bindPopup(    'Mizar');
L.marker(kruegerZ).addTo(map).bindPopup('Krueger-Z');
L.marker(   deneb).addTo(map).bindPopup(    'Deneb');
var travel = L.polyline([sol, deneb]).addTo(map);
The map looks pretty much the same, but the code is a bit more readable:

マップは全く同じように見えますが、コードはもう少し読みやすくなっています。


コード全体
<!DOCTYPE html>
<html>
 <head>
  <meta charset="UTF-8">
  <link rel="stylesheet" href="./leaflet13/leaflet.css" />
  <script src="./leaflet13/leaflet.js"></script>
  <title>Non-geographical maps</title>
 </head>
 <body>
  <div id="map" style="width: 600px; height: 400px;"></div>
  <script>
   //CRS.Simple
   var map = L.map('map', {
    crs: L.CRS.Simple,
    minZoom: -5 //Common gotchas in CRS.Simple maps
   });
   // var bounds = [[0,0], [1000,1000]];
   //Pixels vs. map units
   var bounds = [[-35.4,-41.5], [1040.8,1035.4]];
   var image = L.imageOverlay('uqm_map_07.png', bounds).addTo(map);
   /*
   map.fitBounds(bounds);
   
   var sol = L.latLng([ 145, 175.2 ]);
   L.marker(sol).addTo(map);
   map.setView( [70, 120], 1);
   */
   //This is not the LatLng you’re looking for
   var yx = L.latLng;

   var xy = function(x, y) {
    if (L.Util.isArray(x)) {  // When doing xy([x, y]);
     return yx(x[1], x[0]);
    }
    return yx(y, x);  // When doing xy(x, y);
   };
   var sol      = xy(175.2, 145.0);
   var mizar    = xy( 41.6, 130.1);
   var kruegerZ = xy( 13.4,  56.5);
   var deneb    = xy(218.7,   8.3);
   L.marker(     sol).addTo(map).bindPopup(      'Sol');
   L.marker(   mizar).addTo(map).bindPopup(    'Mizar');
   L.marker(kruegerZ).addTo(map).bindPopup('Krueger-Z');
   L.marker(   deneb).addTo(map).bindPopup(    'Deneb');
   var travel = L.polyline([sol, deneb]).addTo(map);
   map.setView( [70, 120], 1);
  </script>
 </body>
</html>

2018年5月21日月曜日

Leaflet 1.3 - 4-7 Zoom levels

4-7 Zoom levels

Zoom levels

Leaflet works with latitude, longitude and “zoom level”.

Leaflet は、緯度、経度と「ズームレベル」で動作します。

Lower zoom levels means that the map shows entire continents, while higher zoom levels means that the map can show details of a city.

低いズームレベルは、マップが大陸全体を表示することを意味し、一方で、高いズームレベルは、マップが街の詳細を表示することを意味します。

To understand how zoom levels work, first we need a basic introduction to geodesy.

ズームレベルがどのように動作するかを理解することは、最初に測地学の基本的な入門が必要です。


The shape of the earth
地球の形

Let’s have a look at a simple map locked at zoom zero:

ズームを0に固定した単純なマップをみてみましょう。
var map = L.map('map', {
 minZoom: 0,
 maxZoom: 0
});

var cartodbAttribution = '&copy; <a href="https://www.openstreetmap.org/copyright">OpenStreetMap</a> contributors, &copy; <a href="http://cartodb.com/attributions">CartoDB</a>';

var positron = L.tileLayer('http://{s}.basemaps.cartocdn.com/light_all/{z}/{x}/{y}.png', {
 attribution: cartodbAttribution
}).addTo(map);

map.setView([0, 0], 0);


Notice that the “whole earth” is just one image, 256 pixels wide and 256 pixels high:

全地球は、幅256ピクセルと高さ256ピクセルのちょうど一つの画像ということに注意押してください:
(訳注:Web ブラウザが Firefox なら、表示されたマップを右クリックして、「ページの情報を表示」をクリックします。「ページ情報」ダイアログで「メディア」をクリックすると、「メディアプレビュー」に画像が表示されます。「名前をつけて保存」ボタンをクリックして保存ができます。


Just to be clear: the earth is not a square. Rather, the earth is shaped like a weird potato that can be approximated to something similar to a sphere.

はっきりさせたいことは:地球は球ではありません。地球は、球に近いものに似せた不格好なじゃがいものように形作られています。

GRACE globe animation
Potato earth image by NASA/JPL/University of Texas Center for Space Research with help of the GRACE satellites.

So we assume that the earth is mosly round. To make it flat, we put an imaginary cylinder around, unroll it, and cut it so it looks square:

それで、地球はほとんど球形と仮定します。それを平面にするため、仮想の円筒を周りに置き、展開し、そして、四角に見えるように切ります。

Usgs map mercator
This is called a "cylindrical map projection".

This is not the only way of displaying the surface on the earth on a plane. There are hundreds of ways, each of them with its own advantages and disadvantages. The following 6-minute video is a nice introduction to the topic:

これは地球の表面を平面に表示するただ一つの方法ではありません。それぞれに長所と短所がある、何百の方法があります。次の6分ビデオはトピックの良い入門です:

Things like geodesy, map projections and coordinate systems are hard, very hard (and out of scope for this tutorial). Assuming that the earth is a square is not always the right thing to do, but most of the time works fine enough, makes things simpler, and allows Leaflet (and other map libraries) to be fast.

測地学のようなもの、マッププロジェクション(投影法)、および、コーディネーション(座標)システムは、難しい、大変難しいものです(そして、このチュートリアルの範囲外です)。地球が正方形と仮定することは、いつも正しい行いではありませんが、大抵の場合、十分にうまくいき、ものをより単純にし、そして、Leaflet(と他のマップライブラリ)を高速にします。


Powers of two
2の累乗

For now, let’s just assume that the world is a square:

とりあえず、世界が正方形であると仮定します:

When we represent the world at zoom level zero, it’s 256 pixels wide and high. When we go into zoom level one, it doubles its width and height, and can be represented by four 256-pixel-by-256-pixel images:

世界をズーム0で表示するとき、それは幅と高さが256ピクセルです。ズームレベル1にするとき、その幅と高さを2倍にし、そして、4つの256x256ピクセルの画像によって表示されます:

At each zoom level, each tile is divided in four, and its size (length of the edge, given by the tileSize option) doubles, quadrupling the area. (in other words, the width and height of the world is 256·2zoomlevel pixels):

各ズームレベルで、各タイルは4つに分割され、そして、そのサイズ(tileSize オプションによって与えられる縁の長さ)は2倍、面積は4倍、になります。(言い換えれば、世界の幅と高さは、256·2zoomlevel ピクセルです):
       
Zoom 0    Zoom 1    Zoom 2

This goes on and on. Most tile services offer tiles up to zoom level 18, depending on their coverage. This is enough to see a few city blocks per tile.

これは延々と続きます。ほとんどのタイルサービスは、適用範囲に従って、ズームレベル18までタイルを提供します。これは、1タイルごとに2、3のシティブロックを見るのに十分です。


A note about scale
スケールについての注意

One of the disadvantages of using a cylindrical projection is that the scale is not constant, and measuring distances or sizes is not reliable, specially at low zoom levels.

円筒図法を使用する短所の一つは、縮尺が一定ではなく、距離またはサイズを測定することは、特に低いズームレベルでは、正確ではありません。

In technical terms, the cylindrical projection that Leaflet uses is conformal (preserves shapes), but not equidistant (does not preserve distances), and not equal-area (does not preserve areas, as things near the equator appear smaller than they are).

技術的な面では、Leaflet が使用する円筒図法は等角(形状を維持する)ですが、等距離(距離を維持しない)ではなく、そして、等面積(赤道付近のものはそれらより小さく現れるので、面積を維持しない)ではありません。

By adding a L.Control.Scale to a map, and panning to the equator and to 60° north, we can see how the scale factor doubles. The following example uses javascript timeouts to do this automatically:

マップに L.Control.Scale を追加することによって、赤道に、そして、北緯60度にパンするとき、どのようにスケールファクタが2倍になるかわかります。次の例は、これを自動的に実行するために javascript timeout を使用します:
L.control.scale().addTo(map);

setInterval(function(){
 map.setView([0, 0]);
 setTimeout(function(){
  map.setView([60, 0]);
 }, 2000);
}, 4000);


L.Control.Scale shows the scale which applies to the center point of the map. At high zoom levels, the scale changes very little, and is not noticeable.

L.Control.Scale は、マップの中心点に適用するスケールを示します。高いズームレベルで、スケールはとても小さく変化し、目立ちません。


Controlling the zoom
ズームのコントロール

A leaflet map has several ways to control the zoom level shown, but the most obvious one is setZoom(). For example, map.setZoom(0); will set the zoom level of map to 0.

leaflet マップは、示されたズームレベルをコントロールするいくつかの方法がありますが、最もわかりやすいものは setZoom() です。例えば、map.setZoom(0); は、マップのズームレベルを0に設定します。

This example again uses timeouts to alternate between zoom levels 0 and 1 automatically:

この例では、timeout をズームレベル0と1の間を自動的に選択するために再び使用します:
setInterval(function(){
 map.setZoom(0);
 setTimeout(function(){
  map.setZoom(1);
 }, 2000);
}, 4000);


Notice how the images shown at zoom levels 0 and one correspond with the images shown in the previous section!

ズームレベル0と1(?)で表示される画像と前のセクションで表示される画像がどのように対応するか注意してください。

Other ways of setting the zoom are:
ズームをせ呈する他の方法は:

● setView(center, zoom), which also sets the map center
● flyTo(center, zoom), like setView but with a smooth animation
● zoomIn() / zoomIn(delta), zooms in delta zoom levels, 1 by default
● zoomOut() / zoomOut(delta), zooms out delta zoom levels, 1 by default
● setZoomAround(fixedPoint, zoom), sets the zoom level while keeping a point fixed (what scrollwheel zooming does)
● fitBounds(bounds), automatically calculates the zoom to fit a rectangular area on the map

● setView(center, zoom), マップの中心も設定します
● flyTo(center, zoom), setView に似ていますが滑らかなアニメーションです
● zoomIn() / zoomIn(delta), delta ズームレベルにズームインします, 初期値は1
● zoomOut() / zoomOut(delta), delta ズームレベルにズームアウトします, 初期値は1
● setZoomAround(fixedPoint, zoom), 固定された点を維持しながらズームレベルを設定します(スクロールホイールズーム機能)
● fitBounds(bounds), マップ上の矩形領域に合わせるためにズームを自動的に計算します


Fractional zoom
分数(端数)ズーム

A feature introduced in Leaflet 1.0.0 was the concept of fractional zoom. Before this, the zoom level of the map could be only an integer number (0, 1, 2, and so on); but now you can use fractional numbers like 1.5 or 1.25.

Leaflet 1.0.0 で紹介された機能は、分数(端数)ズームコンセプトでした。これ以前は、マップのズームレベルは整数(0、1、2 など)だけでした:しかし、現在は 1.5 や 1.25 のような分数(端数)を使用できます。

Fractional zoom is disabled by default. To enable it, use the map’s zoomSnap option. The zoomSnap option has a default value of 1 (which means that the zoom level of the map can be 0, 1, 2, and so on).

分数(端数)ズームはデフォルトにできません。それを可能にするために、map の zoomSnap オプションを使用します。zoomSnap は、1の初期値をもっています(マップのズームレベルが0、1、2 などにできることを意味します)。

If you set the value of zoomSnap to 0.5, the valid zoom levels of the map will be 0, 0.5, 1, 1.5, 2, and so on.

もし zoomSnap 後を 0.5 に設定するとマップの有効なズームレベルは0、0.5、1、1.5、2 などになります。

If you set a value of 0.1, the valid zoom levels of the map will be 0, 0.1, 0.2, 0.3, 0.4, and so on.

もし zoomSnap 後を 0.1 に設定するとマップの有効なズームレベルは0、0.1、0.2、0.3、0.4 などになります。

The following example uses a zoomSnap value of 0.25:

次の例は、0.25 の zoomSnap 値を使用します:
var map = L.map('map', {
 zoomSnap: 0.25
});


As you can see, Leaflet will only load the tiles for zoom levels 0 or 1, and will scale them as needed.

このように、Leaflet はズームレベル 0 または 1 のタイルをロードするだけで、必要に応じてそれらを縮尺で描画します。

Leaflet will snap the zoom level to the closest valid one. For example, if you have zoomSnap: 0.25 and you try to do map.setZoom(0.8), the zoom will snap back to 0.75. The same happens with map.fitBounds(bounds), or when ending a pinch-zoom gesture on a touchscreen.

Leaflet は、ズームレベルを最も近い値に調整します。例えば、もし zoomSnap: 0.25 で map.setZoom(0.8) を実行するなら、ズームは 0.75 に戻って調整します。同じことは、タッチスクリーンでピンチズームジェスチャを終了するとき、map.fitBounds(bounds) を使用すると発生します。

zoomSnap can be set to zero. This means that Leaflet will not snap the zoom level.

zoomSnap は、0 に設定できます。これは、Leaflet がズームレベルを調整しないことを意味します。

There is another important map option related to zoomSnap: the zoomDelta option. This controls how many zoom levels to zoom in/out when using the zoom buttons (from the default L.Control.Zoom) or the +/- keys in your keyboard.

zoomSnap に関係したもう一つ重要なマップオプション:zoomDelta があります。これは、(デフォルトの L.Control.Zoom から)ズームボタンを、または、キーボードの +/- キーを使用するとき、ズームを in/out するズームレベルの数をコントロールします。

For the mousewheel zoom, the wheelPxPerZoomLevel option controls how fast the mousewheel zooms in our(訳注:or[?]) out.

マウスホイールズームのために、wheelPxPerZoomLevel オプションは、マウスホイールがズームイン、または、アウトする速さをコントロールします。

Here is an example with zoomSnap set to zero:

これは、0 に設定された zoomSnap を使用した例です:
var map = L.map('map', {
 zoomDelta: 0.25,
 zoomSnap: 0
});

Try the following, and see how the zoom level changes:

次を試し、ズームレベルがどのように変わるかみてみます:

● Pinch-zoom if you have a touchscreen
● Zoom in/out with your mousewheel
● Do a box zoom (drag with your mouse while pressing the shift key in your keyboard)
● Use the zoom in/out buttons

● タッチスクリーンがあるならピンチズーム
● マウスホイールでズームをイン/アウト
● ボックスズームを実行(キーボードの shift キーを押しながらマウスをドラッグ)
● ズームン/アウトボタンを使用


That concludes this tutorial. Now play with your zoom levels in your maps!

それはこのチュートリアル締めくくります。では、マップでズームレベルを使ってみましょう。

全コード
<!DOCTYPE html>
<html>
 <head>
  <meta charset="UTF-8">
  <link rel="stylesheet" href="./leaflet13/leaflet.css" />
  <script src="./leaflet13/leaflet.js"></script>
  <title>Zoom levels</title>
 </head>
 <body>
  <div id="map" style="width: 600px; height: 400px;"></div>
  <script>
   //The shape of the earth
   /*
   var map = L.map('map', {
    minZoom: 0,
    maxZoom: 0
   });
   */
   //A note about scale
   /*
   var map = L.map('map', {
    minZoom: 1,
    maxZoom: 1,
    dragging: false
   });
   */
   //Controlling the zoom
   /*
   var map = L.map('map', {
    minZoom: 0,
    maxZoom: 1
   });
   */
   //Fractional zoom 1
   /*
   var map = L.map('map', {
    zoomSnap: 0.25
    });
   */
   //Fractional zoom 2
   var map = L.map('map', {
    zoomDelta: 0.25,
    zoomSnap: 0
   });
   var cartodbAttribution = '&copy; <a href="https://www.openstreetmap.org/copyright">OpenStreetMap</a> contributors, © <a href="http://cartodb.com/attributions">CartoDB</a>';
   var positron = L.tileLayer('http://{s}.basemaps.cartocdn.com/light_all/{z}/{x}/{y}.png', {
    attribution: cartodbAttribution
   }).addTo(map);
   //A note about scale
   /*
   L.control.scale({maxWidth: 150}).addTo(map);

   setInterval(function(){
    map.setView([0, 0]);
    setTimeout(function(){
     map.setView([60, 0]);
    }, 2000);
   }, 4000);
   */
   //Controlling the zoom
   /*
   setInterval(function(){
    map.setZoom(0);
    setTimeout(function(){
     map.setZoom(1);
    }, 2000);
   }, 4000);
   */
   //Fractional zoom
   var ZoomViewer = L.Control.extend({
    onAdd: function(){
     var container= L.DomUtil.create('div');
     var gauge = L.DomUtil.create('div');
     container.style.width = '200px';
     container.style.background = 'rgba(255,255,255,0.5)';
     container.style.textAlign = 'left';
     map.on('zoomstart zoom zoomend', function(ev){
      gauge.innerHTML = 'Zoom level: ' + map.getZoom();
      })
     container.appendChild(gauge);
     return container;
    }
   });
   (new ZoomViewer).addTo(map);
   map.setView([0, 0], 0);
   //Fractional zoom 1
   // map.setZoom(0.8);
  </script>
 </body>
</html>

2018年5月10日木曜日

Leaflet 1.3 - 4-6 Layer Groups and Layers Control

4-6 Layer Groups and Layers Control
This tutorial will show you how to group several layers into one, and how to use the layers control to allow users to easily switch different layers on your map.

このチュートリアルは、いくつかのレイヤをグループに分類する方法と、マップ上でユーザに異なるレイヤを簡単に切り換えることを許可するためレイヤコントロールを使用する方法を説明します。


Layer Groups

Let’s suppose you have a bunch of layers you want to combine into a group to handle them as one in your code:

コードに一つとして扱うグループに結びつけたいひとまとまりのレイヤがあると考えます。
var littleton = L.marker([39.61, -105.02]).bindPopup('This is Littleton, CO.'),
    denver    = L.marker([39.74, -104.99]).bindPopup('This is Denver, CO.'),
    aurora    = L.marker([39.73, -104.8]).bindPopup('This is Aurora, CO.'),
    golden    = L.marker([39.77, -105.23]).bindPopup('This is Golden, CO.');
Instead of adding them directly to the map, you can do the following, using the LayerGroup class:

それらをマップに直接追加する代わりに、LayerGroup を使用して、次のようにすることができます。
var cities = L.layerGroup([littleton, denver, aurora, golden]);
Easy enough! Now you have a cities layer that combines your city markers into one layer you can add or remove from the map at once.

簡単ですね!これで、シティマーカをマップからすぐに追加または削除できる一つのレイヤに結び付けるシティレイヤになりました。


Layers Control

Leaflet has a nice little control that allows your users to control which layers they see on your map. In addition to showing you how to use it, we’ll also show you another handy use for layer groups.

Leaflet は、マップ上に見えるレイヤをコントロールすることをユーザに許可するのに良い軽量なコントロールがあります。その使い方を説明することに加えて、レイヤグループのもう一つの手軽な使用も説明します。

There are two types of layers: (1) base layers that are mutually exclusive (only one can be visible on your map at a time), e.g. tile layers, and (2) overlays, which are all the other stuff you put over the base layers. In this example, we want to have two base layers (a grayscale and a colored base map) to switch between, and an overlay to switch on and off: the city markers we created earlier.

2種類のレイヤがあります:(1) 相互に排他的(マップ上に継続的に現れているだけ)なベースレイヤ、例えばタイルレイヤ、と (2) オーバレイヤ、ベースレイヤ上に配置される他の要素すべて、です。この例では、切り替えれれる2つのベースレイヤ(グレースケールと色付けされた基本マップ)と、以前作成したシティマーカのオンとオフを切り替えられる1つのオーバレイを配置します。

Now let’s create those base layers and add the default ones to the map:

最初に、それらのベースレイヤを作成し、マップに初期値を追加します。
var grayscale = L.tileLayer(mapboxUrl, {id: 'MapID', attribution: mapboxAttribution}),
    streets   = L.tileLayer(mapboxUrl, {id: 'MapID', attribution: mapboxAttribution});
var map = L.map('map', {
 center: [39.73, -104.99],
 zoom: 10,
 layers: [grayscale, cities]
});

訳注:今回は、Mapbox の代わりに OpenStreetMap のタイルサーバを使用します。
var grayscale = L.tileLayer('http://{s}.tiles.wmflabs.org/bw-mapnik/{z}/{x}/{y}.png', {
                   attribution: 'Map data &copy; <a href="https://www.openstreetmap.org/copyright">OpenStreetMap</a> contributors'
                   }),
    streets   = L.tileLayer('https://{s}.tile.openstreetmap.org/{z}/{x}/{y}.png', {
                 attribution: 'Map data &copy; <a href="https://www.openstreetmap.org/copyright">OpenStreetMap</a> contributors'
                  });

Next, we’ll create two objects. One will contain our base layers and one will contain our overlays. These are just simple objects with key/value pairs. The key sets the text for the layer in the control (e.g. “Streets”), while the corresponding value is a reference to the layer (e.g. streets).

次に、2つのオブジェクトを作成します。1つはベースレイヤを含み、もう一つはオーバレイを含みます。これらは、key/value 対を使用した簡単なオブジェクトです。key は、コントロール内のレイヤに対するテキストを設定し(例えば、“Streets”)、もう一方、対応する value は、参照するレイヤです(例えば、 streets)。
var baseMaps = {
 "Grayscale": grayscale,
 "Streets": streets
};

var overlayMaps = {
 "Cities": cities
};
Now, all that’s left to do is to create a Layers Control and add it to the map. The first argument passed when creating the layers control is the base layers object. The second argument is the overlays object. Both arguments are optional: you can pass just a base layers object by omitting the second argument, or just an overlays objects by passing null as the first argument. In each case, the omitted layer type will not appear for the user to select.

ここで、後は、Layers Control(Leaflet API)を作成し、マップに追加するだけです。layers control を作成するとき渡される第1引数は、ベースレイヤオブジェクトです。第2引数は、オーバレイオブジェクトです。両方の引数はオプションです:第2引数を省略することによってベースレイヤオブジェクトだけを、または、第1引数のように null を渡すことによってオーバレイオブジェクトだけ渡すことができます。どちらの場合も、省略されたレイヤタイプは、ユーザが選択しても現れません。
L.control.layers(baseMaps, overlayMaps).addTo(map);
Note that we added grayscale and cities layers to the map but didn’t add streets. The layers control is smart enough to detect what layers we’ve already added and have corresponding checkboxes and radioboxes set.

グレースケールとシティレイヤをマップに追加しましたが、ストリートは追加しなかったことに注意してください。layers control は、すでに追加されていて対応するチェックボックスとラジオボックス(ボタン)セットがあるレイヤを検出するのに十分性能があります。

Also note that when using multiple base layers, only one of them should be added to the map at instantiation, but all of them should be present in the base layers object when creating the layers control.

同じように、複数のベースレイヤを使用するとき、それらの一つがインスタンス化でマップに追加されるべきですが、それらのすべては layers control を作成するとき、ベースレイヤに表示されるべきだということに注意してください。

Finally, you can style the keys when you define the objects for the layers. For example, this code will make the label for the grayscale map gray:

最後に、レイヤのオブジェクトを定義するとき、key をスタイルできます。例えば、グレースケールマップのラベルをグレーにします。
var baseMaps = {
 "<span style='color: gray'>Grayscale</span>": grayscale,
 "Streets": streets
};
Now let’s view the result on a separate page →

では、別ページの結果を見てみましょう。


全コード
<!DOCTYPE html>
<html>
 <head>
  <meta charset="UTF-8">
  <link rel="stylesheet" href="./leaflet13/leaflet.css" />
  <script src="./leaflet13/leaflet.js"></script>
  <title>Layer Groups and Layers Control</title>
 </head>
 <body>
  <div id="map" style="width: 600px; height: 400px;"></div>
  <script>
   //Layer Groups
   var littleton = L.marker([39.61, -105.02]).bindPopup('This is Littleton, CO.'),
       denver    = L.marker([39.74, -104.99]).bindPopup('This is Denver, CO.'),
       aurora    = L.marker([39.73, -104.8]).bindPopup('This is Aurora, CO.'),
       golden    = L.marker([39.77, -105.23]).bindPopup('This is Golden, CO.');
      var cities = L.layerGroup([littleton, denver, aurora, golden]);
   //Layers Control
   // var grayscale = L.tileLayer(mapboxUrl, {id: 'MapID', attribution: mapboxAttribution}),
   //     streets   = L.tileLayer(mapboxUrl, {id: 'MapID', attribution: mapboxAttribution});
  var grayscale = L.tileLayer('http://{s}.tiles.wmflabs.org/bw-mapnik/{z}/{x}/{y}.png', {
                  attribution: 'Map data &copy; <a href="https://www.openstreetmap.org/copyright">OpenStreetMap</a> contributors'
                  }),
      streets   = L.tileLayer('https://{s}.tile.openstreetmap.org/{z}/{x}/{y}.png', {
                   attribution: 'Map data &copy; <a href="https://www.openstreetmap.org/copyright">OpenStreetMap</a> contributors'
                    });
   var map = L.map('map', {
    center: [39.73, -104.99],
    zoom: 10,
    layers: [grayscale, cities]
   });
   var baseMaps = {
    "<span style='color: gray'>Grayscale</span>": grayscale,
    "Streets": streets
   };
   var overlayMaps = {
    "Cities": cities
   };
   L.control.layers(baseMaps, overlayMaps).addTo(map);
  </script>
 </body>
</html>

2018年5月8日火曜日

Leaflet 1.3 - 4-5 Interactive Choropleth Map

4-5 Interactive Choropleth Map
Interactive Choropleth Map

This is a case study of creating a colorful interactive choropleth map(Choropleth map[https://en.wikipedia.org/wiki/Choropleth_map])of US States Population Density with the help of GeoJSON and some custom controls (that will hopefully convince all the remaining major news and government websites that do not use Leaflet yet to start doing so).

これは、GeoJSON と(始めるために Leaflet をまだ使用していないという残存する主要なニュースと政府のウェッブサイトすべてを納得させることが期待される)いくつかのカスタムコントロール(Control [Leaflet API])の支援を使用して、US States Population Density(アメリカ合衆国州別人口密度)の色とりどりのインタラクティブな choropleth map を作成する事例研究です。

The tutorial was inspired by the Texas Tribune US Senate Runoff Results map (also powered by Leaflet), created by Ryan Murphy.

チュートリアルは、Ryan Murphy によって作成された(Leaflet によっても動作している)Texas Tribune US Senate Runoff Results map から発想を得られています。


Data Source

We’ll be creating a visualization of population density per US state. As the amount of data (state shapes and the density value for each state) is not very big, the most convenient and simple way to store and then display it is GeoJSON.

アメリカの州ごとの人口密度の視覚化をします。データ量(州の形状と州ごとの{人口}密度の値)は大きくないので、それを格納し、それから表示する最も便利で単純な方法は GeoJSON です。

Each feature of our GeoJSON data (us-states.js) will look like this:

GeoJSON データ(us-states.js)の各フィーチャは、このようになっています:
(訳注:「us-states.js」をダウンロードして使用します。)
{
 "type": "Feature",
 "properties": {
  "name": "Alabama",
  "density": 94.65
 },
 "geometry": ...
  ...
}

The GeoJSON with state shapes was kindly shared by Mike Bostock of D3 fame, extended with density values from this Wikipedia article based on July 1st 2011 data from US Census Bureau and assigned to statesData JS variable.

州の形状をを伴った GeoJSON は、D3 で有名な Mike Bostock によって好意的に共有され、米国製調査局の2011年7月1日データを元としたこのウィキペディアの記事からの人口密度を拡張し、statesData JS 変数を割り当てます。


Basic States Map

Let’s display our states data on a map with a custom Mapbox style for nice grayscale tiles that look perfect as a background for visualizations:

マップに可視化のための背景として最適なグレイスケールタイルのカスタム Mapbox スタイルで州のデータを表示します。
var mapboxAccessToken = {your access token here};
var map = L.map('map').setView([37.8, -96], 4);
L.tileLayer('https://api.tiles.mapbox.com/v4/{id}/{z}/{x}/{y}.png?access_token=' + mapboxAccessToken, {
    id: 'mapbox.light',
    attribution: ...
}).addTo(map);

L.geoJson(statesData).addTo(map);

(訳注:実際には、Mapbox の代わりに OpenStreetMap を使用します。)


Adding Some Color

Now we need to color the states according to their population density. Choosing nice colors for a map can be tricky, but there’s a great tool that can help with it — ColorBrewer. Using the values we got from it, we create a function that returns a color based on population density:

最初に、人口密度に従って州を色分けする必要があります。マップに適した色を選ぶことは、巧妙にできますが、それを支援するすぐれたツール - ColorBrewer - があります。そこから取得する値を使用するために、人口密度をもととした色を返すファンクションを作成します:
function getColor(d) {
 return d > 1000 ? '#800026' :
        d > 500  ? '#BD0026' :
        d > 200  ? '#E31A1C' :
        d > 100  ? '#FC4E2A' :
        d > 50   ? '#FD8D3C' :
        d > 20   ? '#FEB24C' :
        d > 10   ? '#FED976' :
                      '#FFEDA0';
}

Next we define a styling function for our GeoJSON layer so that its fillColor depends on feature.properties.density property, also adjusting the appearance a bit and adding a nice touch with dashed stroke.

次に、fillColor は、feature.properties.density プロパティに依存し、同じように、外観を少し調整したりダッシュストロークで最適なタッチを追加するように、GeoJSON レイヤのスタイルファンクションを定義します。
function style(feature) {
 return {
  fillColor: getColor(feature.properties.density),
  weight: 2,
  opacity: 1,
  color: 'white',
  dashArray: '3',
  fillOpacity: 0.7
 };
}
L.geoJson(statesData, {style: style}).addTo(map);

Looks much better now!

これで見た目が良くなりました。


Adding Interaction

Now let’s make the states highlighted visually in some way when they are hovered with a mouse. First we’ll define an event listener for layer mouseover event:

では、マウスでホバー(ポインタをかざ)されるとき、いくつかの方法で州を視覚的に強調します。最初に、layer mouseover イベントに対するイベントリスナを定義します:
function highlightFeature(e) {
 var layer = e.target;

 layer.setStyle({
  weight: 5,
  color: '#666',
  dashArray: '',
  fillOpacity: 0.7
 });
 if (!L.Browser.ie && !L.Browser.opera && !L.Browser.edge) {
  layer.bringToFront();
 }
}

Here we get access to the layer that was hovered through e.target, set a thick grey border on the layer as our highlight effect, also bringing it to the front so that the border doesn’t clash with nearby states (but not for IE, Opera or Edge, since they have problems doing bringToFront on mouseover).

ここで、e.target を通してホバーされたレイヤにアクセスし、強調効果としてレイヤの薄いグレーの境界を設定し、境界が近くの州と衝突しないために前面にも持っていきます。(しかし、IE や Opera、Edge 用ではありません。それは、mouseover 上で bringToFront を実行する問題があるためです。)

Next we’ll define what happens on mouseout:

次に、mouseout で発生することを定義します。
function resetHighlight(e) {
 geojson.resetStyle(e.target);
}

The handy geojson.resetStyle method will reset the layer style to its default state (defined by our style function). For this to work, make sure our GeoJSON layer is accessible through the geojson variable by defining it before our listeners and assigning the layer to it later:

手軽な geojson.resetStyle メソッドは、レイヤスタイルを(style ファンクションによって定義される)初期状態に再設定します。これが動作するために、リスナの前にそれを定義することによって geojson 変数を通して、GeoJSON がアクセス可能になることを確かめ、後でレイヤをそれに割り当てます:
var geojson;
// ... our listeners
geojson = L.geoJson(...);

As an additional touch, let’s define a click listener that zooms to the state:

追加タッチのために、州に焦点を当てる click リスナを定義しましょう:
function zoomToFeature(e) {
 map.fitBounds(e.target.getBounds());
}

Now we’ll use the onEachFeature option to add the listeners on our state layers:

ここで、州レイヤにリスナを追加するために onEachFeature オプションを使用します:
function onEachFeature(feature, layer) {
 layer.on({
  mouseover: highlightFeature,
  mouseout: resetHighlight,
  click: zoomToFeature
 });
}
geojson = L.geoJson(statesData, {
 style: style,
 onEachFeature: onEachFeature
}).addTo(map);

This makes the states highlight nicely on hover and gives us the ability to add other interactions inside our listeners.

これでホバーして州をうまくハイライト(強調)させ、リスナ内の他のインタラクションを追加する性能を与えます。


Custom Info Control

We could use the usual popups on click to show information about different states, but we’ll choose a different route — showing it on state hover inside a custom control.

異なった州について情報を表示するためにクリックで通常のポップアップを使用しますが、違ったルート - カスタムコントロール内で州がホバー状態でそれを表示することを選びます。

Here’s the code for our control:

これはコントロールのコードです:
var info = L.control();

info.onAdd = function (map) {
 this._div = L.DomUtil.create('div', 'info'); // create a div with a class "info"
 this.update();
 return this._div;
};
// method that we will use to update the control based on feature properties passed
info.update = function (props) {
 this._div.innerHTML = '<h4>US Population Density</h4>' +  (props ?
  '<b>' + props.name + '</b><br />' + props.density + ' people / mi<sup>2</sup>'
  : 'Hover over a state');
};
info.addTo(map);

We need to update the control when the user hovers over a state, so we’ll also modify our listeners as follows:

ユーザが州の上をホバーしたときコントロールが更新される必要があり、それで、次のようにリスナも変更します:
function highlightFeature(e) {
 ...
 info.update(layer.feature.properties);
}
function resetHighlight(e) {
 ...
 info.update();
}

The control also needs some CSS styles to look nice:

コントロールは、よく見えるためにいくつかの CSS スタイルも必要です:
.info {
 padding: 6px 8px;
 font: 14px/16px Arial, Helvetica, sans-serif;
 background: white;
 background: rgba(255,255,255,0.8);
 box-shadow: 0 0 15px rgba(0,0,0,0.2);
 border-radius: 5px;
}
.info h4 {
 margin: 0 0 5px;
 color: #777;
}


Custom Legend Control

Creating a control with a legend is easier, since it is static and doesn’t change on state hover. JavaScript code:

凡例とともにコントロールを作成することはもっと簡単で、そのため、それは静的で、州がホバーした状態で変更しません:
var legend = L.control({position: 'bottomright'});
legend.onAdd = function (map) {
 var div = L.DomUtil.create('div', 'info legend'),
     grades = [0, 10, 20, 50, 100, 200, 500, 1000],
     labels = [];
 // loop through our density intervals and generate a label with a colored square for each interval
 for (var i = 0; i < grades.length; i++) {
  div.innerHTML +=
   '<i style="background:' + getColor(grades[i] + 1) + '"></i> ' +
   grades[i] + (grades[i + 1] ? '–' + grades[i + 1] + '<br>' : '+');
 }
 return div;
};

legend.addTo(map);

CSS styles for the control (we also reuse the info class defined earlier):

コントロールのための CSS スタイル(前に定義された info クラスも再利用します)
.legend {
 line-height: 18px;
 color: #555;
}
.legend i {
 width: 18px;
 height: 18px;
 float: left;
 margin-right: 8px;
 opacity: 0.7;
}

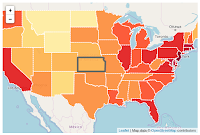
Enjoy the result on the top of this page, or on a separate page.

このページの上部の結果、または、別ページを見てください。


全コード
<!DOCTYPE html>
<html>
 <head>
  <meta charset="UTF-8">
  <link rel="stylesheet" href="./leaflet13/leaflet.css" />
  <style>
  /* Custom Info Control */
   .info {
    padding: 6px 8px;
    font: 14px/16px Arial, Helvetica, sans-serif;
    background: white;
    background: rgba(255,255,255,0.8);
    box-shadow: 0 0 15px rgba(0,0,0,0.2);
    border-radius: 5px;
   }
   .info h4 {
    margin: 0 0 5px;
    color: #777;
   }
   /* Custom Legend Control */
   .legend {
    line-height: 18px;
    color: #555;
   }
   .legend i {
    width: 18px;
    height: 18px;
    float: left;
    margin-right: 8px;
    opacity: 0.7;
   }
  </style>
  <script src="./leaflet13/leaflet.js"></script>
  <title>Interactive Choropleth Map</title>
 </head>
 <body>
  <div id="map" style="width: 600px; height: 400px;"></div>
  <script type="text/javascript" src="us-states.js"></script>
  <script>
   //Basic States Map
   var map = L.map('map').setView([37.8, -96], 4);
   
   L.tileLayer('https://{s}.tile.openstreetmap.org/{z}/{x}/{y}.png', {
  attribution: 'Map data &copy; <a href="https://www.openstreetmap.org/copyright">OpenStreetMap</a> contributors'
   }).addTo(map);
   
   // var geojson = L.geoJSON(statesData).addTo(map);
   //Adding Some Color
   function getColor(d) {
    return d > 1000 ? '#800026' :
           d > 500  ? '#BD0026' :
           d > 200  ? '#E31A1C' :
           d > 100  ? '#FC4E2A' :
           d > 50   ? '#FD8D3C' :
           d > 20   ? '#FEB24C' :
           d > 10   ? '#FED976' :
                      '#FFEDA0';
   }
   function style(feature) {
    return {
     fillColor: getColor(feature.properties.density),
     weight: 2,
     opacity: 1,
     color: 'white',
     dashArray: '3',
     fillOpacity: 0.7
    };
   }
   L.geoJson(statesData, {style: style}).addTo(map);
   //Adding Interaction
   function highlightFeature(e) {
    var layer = e.target;

    layer.setStyle({
     weight: 5,
     color: '#666',
     dashArray: '',
     fillOpacity: 0.7
    });
    if (!L.Browser.ie && !L.Browser.opera && !L.Browser.edge) {
     layer.bringToFront();
    }
    info.update(layer.feature.properties); //Custom Info Control
   }
   function resetHighlight(e) {
    geojson.resetStyle(e.target);
    info.update(); //Custom Info Control
   }
   function zoomToFeature(e) {
    map.fitBounds(e.target.getBounds());
   }
   function onEachFeature(feature, layer) {
    layer.on({
     mouseover: highlightFeature,
     mouseout: resetHighlight,
     click: zoomToFeature
    });
   }
   geojson = L.geoJson(statesData, {
    style: style,
    onEachFeature: onEachFeature
   }).addTo(map);
   //Custom Info Control
   var info = L.control();
   info.onAdd = function (map) {
    this._div = L.DomUtil.create('div', 'info'); // create a div with a class "info"
    this.update();
    return this._div;
   };
   // method that we will use to update the control based on feature properties passed
   info.update = function (props) {
    this._div.innerHTML = '<h4>US Population Density</h4>' +  (props ?
     '<b>' + props.name + '</b><br />' + props.density + ' people / mi<sup>2</sup>'
     : 'Hover over a state');
   };
   info.addTo(map);
   //Custom Legend Control
   var legend = L.control({position: 'bottomright'});
   legend.onAdd = function (map) {

    var div = L.DomUtil.create('div', 'info legend'),
     grades = [0, 10, 20, 50, 100, 200, 500, 1000],
     labels = [];
     // loop through our density intervals and generate a label with a colored square for each interval
     for (var i = 0; i < grades.length; i++) {
      div.innerHTML +=
       '<i style="background:' + getColor(grades[i] + 1) + '"></i> ' +
       grades[i] + (grades[i + 1] ? '&ndash;' + grades[i + 1] + '<br>' : '+');
     }
    return div;
   };

   legend.addTo(map);
  </script>
 </body>
</html>