2010年12月19日日曜日

GeoExt28 Feature Renderer

GeoExt.FeatureRenderer

Example サイト
http://www.geoext.org/examples.html

「Feature Renderer」リンクをクリックすると GeoExt.FeatureRenderer が表示されます。
renderer.js. を参考にします。

説明を意訳すると、FeatureRenderer は symbolizers のリストが与えられた OpenLayers.Feature.Vector オブジェクトを描画します。

以前表示されなかった graphicName: "star" が表示されました。理由は不明です。

// スタイル設定
var blue = {
fillColor: "blue",
fillOpacity: 0.25,
strokeColor: "blue",
strokeWidth: 2,
pointRadius: 5
};

var custom = {
point: {
graphicName: "star",
pointRadius: 8,
fillColor: "yellow",
strokeColor: "red",
strokeWidth: 1
},
line: {
strokeColor: "#669900",
strokeWidth: 3
},
poly: {
fillColor: "olive",
fillOpacity: 0.25,
strokeColor: "#666666",
strokeWidth: 2,
strokeDashstyle: "dot"
}
};

var stacked = {
point: [{
pointRadius: 8,
fillColor: "white",
strokeColor: "red",
strokeWidth: 2
}, {
graphicName: "star",
pointRadius: 5,
fillColor: "red"
}],
line: [{
strokeColor: "red",
strokeWidth: 5
}, {
strokeColor: "#ff9933",
strokeWidth: 2
}],
poly: [{
strokeWidth: 3,
fillColor: "white",
strokeColor: "#669900"
}, {
strokeWidth: 2,
fillOpacity: 0,
strokeColor: "red",
strokeDashstyle: "dot"
}]
};

var configs = [{
symbolType: "Point", // 初期値のスタイル
renderTo: "point_default"
}, {
symbolType: "Line",
renderTo: "line_default"
}, {
symbolType: "Polygon",
renderTo: "poly_default"
}, {
symbolType: "Point",
symbolizers: [blue], // "blue" スタイル
renderTo: "point_blue"
}, {
symbolType: "Line",
symbolizers: [blue],
renderTo: "line_blue"
}, {
symbolType: "Polygon",
symbolizers: [blue],
renderTo: "poly_blue"
}, {
symbolType: "Point",
symbolizers: [custom.point], // "custom" スタイル
renderTo: "point_custom"
}, {
symbolType: "Line",
symbolizers: [custom.line],
renderTo: "line_custom"
}, {
symbolType: "Polygon",
symbolizers: [custom.poly],
renderTo: "poly_custom"
}, {
symbolType: "Point",
symbolizers: stacked.point, // "stacked" スタイル
renderTo: "point_stacked"
}, {
symbolType: "Line",
symbolizers: stacked.line,
renderTo: "line_stacked"
}, {
symbolType: "Polygon",
symbolizers: stacked.poly,
renderTo: "poly_stacked"
}];

// フィーチャの描画
Ext.onReady(function() {
for(var i=0; i<configs.length; ++i) {
new GeoExt.FeatureRenderer(configs[i]);
}
$("render").onclick = render;
});


var format = new OpenLayers.Format.WKT();
var renderer, win;
function render() {
var wkt = $("wkt").value;
var feature;
try {
feature = format.read(wkt)
} catch(err) {
$("wkt").value = "Bad WKT: " + err;
}
var symbolizers;
try {
var value = $("symbolizers").value;
symbolizers = eval("(" + value + ")");
if (!symbolizers || symbolizers.constructor !== Array) {
throw "Must be an array literal";
}
} catch(err) {
$("symbolizers").value = "Bad symbolizers: " + err + "\n\n" + value;
symbolizers = null;
}
if(feature && symbolizers) {
if(!win) {
renderer = new GeoExt.FeatureRenderer({
feature: feature,
symbolizers: symbolizers,
width: 150,
style: {margin: 4}
});
win = new Ext.Window({
closeAction: "hide",
layout: "fit",
width: 175,
items: [renderer]
});
} else {
renderer.update({
feature: feature,
symbolizers: symbolizers
});
}
win.show();
}
}

HTML ファイルを新規作成します。
「openlayersTokyoproj」 を右クリックして 新規 -> HTML ファイル をクリック。
「HTML ファイル」ウィンドウの「ファイル名(任意:geoext28_renderer.html)」に入力して「完了」ボタンをクリック。
「charset」を「utf-8」にします。
以下のように HTML を作成します。
geoext27_print-form.html をコピーし、外部 JavaScript 読み込みファイルを修正しスタイルシートを設定し body タグ内にターゲット id を設定します。

---
<title>GeoExt28 Feature Renderer</title>
---
<!-- renderer.js 追加 -->
<script type="text/javascript" src="./renderer.js"></script>
<!-- スタイルシート設定 -->
<style type="text/css">
.x-window-body {
background-color: white;
}
#swatches {
padding: 1em;
}
#swatches td {
border: 1px solid #ccc;
text-align: center;
margin: 0 auto;
padding: 0.5em;
}
#swatches td div div {
text-align: left; /* IE centers VML in root otherwise */
}
#wkt {
width: 400px;
height: 100px;
}
#symbolizers {
width: 400px;
height: 150px;
}
</style>
</head>


<body>
<div id="panel"></div>
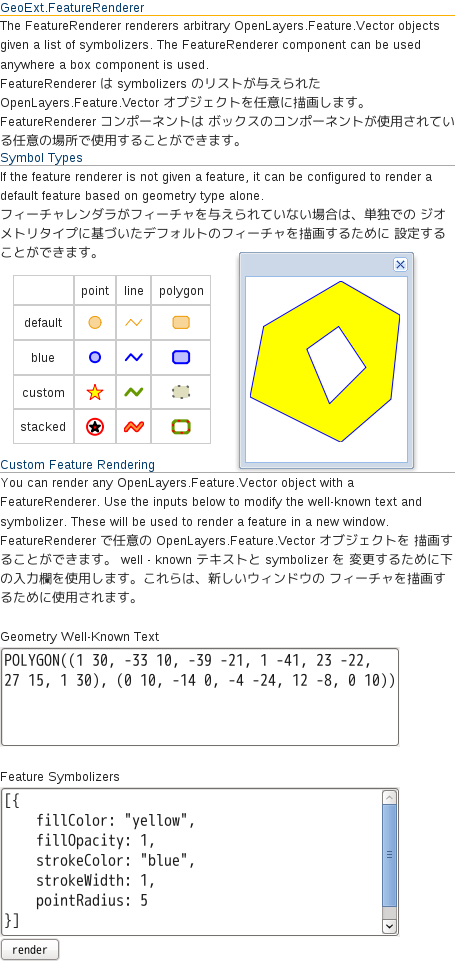
<h1>GeoExt.FeatureRenderer</h1>

<p>The FeatureRenderer renderers arbitrary OpenLayers.Feature.Vector
objects given a list of symbolizers. The FeatureRenderer
component can be used anywhere a box component is used.</p>

<p>FeatureRenderer は symbolizers のリストが与えられた OpenLayers.Feature.Vector
オブジェクトを任意に描画します。 FeatureRenderer コンポーネントは
ボックスのコンポーネントが使用されている任意の場所で使用することができます。</p>


<h2>Symbol Types</h2>
<p>If the feature renderer is not given a feature, it can be
configured to render a default feature based on geometry type
alone.</p>

<p>フィーチャレンダラがフィーチャを与えられていない場合は、単独での
ジオメトリタイプに基づいたデフォルトのフィーチャを描画するために
設定することができます。</p>


<table id="swatches">
<tbody>
<tr><td> </td><td>point</td><td>line</td><td>polygon</td></tr>
<tr>
<td>default</td>
<td id="point_default"></td>
<td id="line_default"></td>
<td id="poly_default"></td>
</tr>
<tr>
<td>blue</td>
<td id="point_blue"></td>
<td id="line_blue"></td>
<td id="poly_blue"></td>
</tr>
<tr>
<td>custom</td>
<td id="point_custom"></td>
<td id="line_custom"></td>
<td id="poly_custom"></td>
</tr>
</tr>
<tr>
<td>stacked</td>
<td id="point_stacked"></td>
<td id="line_stacked"></td>
<td id="poly_stacked"></td>
</tr>
</tbody>
</table>


<h2>Custom Feature Rendering</h2>
<p>You can render any OpenLayers.Feature.Vector object with a
FeatureRenderer.
Use the inputs below to modify the well-known text and
symbolizer. These will be used to render a feature in a new
window.</p>
<p>FeatureRenderer で任意の OpenLayers.Feature.Vector オブジェクトを
描画することができます。 well - known テキストと symbolizer を
変更するために下の入力欄を使用します。これらは、新しいウィンドウの
フィーチャを描画するために使用されます。</p><br>
<label for="wkt">Geometry Well-Known Text</label><br>
<textarea id="wkt">
POLYGON((1 30, -33 10, -39 -21, 1 -41, 23 -22, 27 15, 1 30), (0 10, -14 0, -4 -24, 12 -8, 0 10))
</textarea><br><br>

<label for="symbolizers">Feature Symbolizers</label><br>
<textarea id="symbolizers">
[{
fillColor: "yellow",
fillOpacity: 1,
strokeColor: "blue",
strokeWidth: 1,
pointRadius: 5
}]
</textarea><br>
<button id="render">render</button>
</body>
</html>

2010年12月18日土曜日

GeoExt27 Print Configration with a Form

Advanced Printing with Special Form Fields

Example サイト
http://www.geoext.org/examples.html

「Print Configration with a Form」リンクをクリックすると Advanced Printing with Special Form Fields が表示されます。
print-form.js. を参考にします。

説明を意訳すると、MapFish または GeoServer 印刷モジュールの形式制御パラメータで、高度な印刷を実現する方法を示します。

var mapPanel, printPage;

Ext.onReady(function() {
// The printProvider that connects us to the print service
var printProvider = new GeoExt.data.PrintProvider({
method: "GET", // "POST" recommended for production use
capabilities: printCapabilities, // from the info.json script in the html
customParams: {
mapTitle: "Printing Demo"
}
});
// Our print page. Stores scale, center and rotation and gives us a page
// extent feature that we can add to a layer.
printPage = new GeoExt.data.PrintPage({
printProvider: printProvider
});


// A layer to display the print page extent
var pageLayer = new OpenLayers.Layer.Vector();
pageLayer.addFeatures(printPage.feature);


// The map we want to print
mapPanel = new GeoExt.MapPanel({
region: "center",
map: {
eventListeners: {
// recenter/resize page extent after pan/zoom
"moveend": function(){ printPage.fit(this, {mode: "screen"}); }
},
// 東京都用マップ設定
controls: [
new OpenLayers.Control.PanZoom(),
new OpenLayers.Control.LayerSwitcher(),
new OpenLayers.Control.MousePosition(),
new OpenLayers.Control.ScaleLine()
],
projection: new OpenLayers.Projection("EPSG:2456"),
maxResolution: 'auto',
maxExtent: new OpenLayers.Bounds(-279000,1054000,-185000,1104000),
units: 'meters',
displayProjection: new OpenLayers.Projection("EPSG:4326")
},


/*
layers: [
new OpenLayers.Layer.WMS("Tasmania", "http://demo.opengeo.org/geoserver/wms",
{layers: "topp:tasmania_state_boundaries"}, {singleTile: true}),
pageLayer
],
*/
layers: [
// 東京都レイヤ
new OpenLayers.Layer.WMS( "Tokyo Height WMS",
"http://192.168.1.6/cgi-bin/mapserv?",
{
map: '/home/user/mapfile/tokyo_bmi_pgis_img2.map',
layers: 'height',
format: 'image/png'
}, {
singleTile: true
}),
new OpenLayers.Layer.WMS( "Tokyo Kukaku Sen WMS",
"http://192.168.1.6/cgi-bin/mapserv?",
{
map: '/home/user/mapfile/tokyo_bmi_pgis_img2.map',
layers: 'kukaku',
transparent: true,
format: 'image/png'
}, {
singleTile: true
}),
pageLayer
],
// center: [146.56, -41.56],
// zoom: 6
});


// The form with fields controlling the print output
var formPanel = new Ext.form.FormPanel({
region: "west",
width: 150,
bodyStyle: "padding:5px",
labelAlign: "top",
defaults: {anchor: "100%"},
items: [{


xtype: "textarea",
name: "comment",
value: "",
fieldLabel: "Comment",
plugins: new GeoExt.plugins.PrintPageField({
printPage: printPage
})
}, {


xtype: "combo",
store: printProvider.layouts,
displayField: "name",
fieldLabel: "Layout",
typeAhead: true,
mode: "local",
triggerAction: "all",
plugins: new GeoExt.plugins.PrintProviderField({
printProvider: printProvider
})
}, {


xtype: "combo",
store: printProvider.dpis,
displayField: "name",
fieldLabel: "Resolution",
tpl: '<tpl for="."><div class="x-combo-list-item">{name} dpi</div></tpl>',
typeAhead: true,
mode: "local",
triggerAction: "all",
plugins: new GeoExt.plugins.PrintProviderField({
printProvider: printProvider
}),
// the plugin will work even if we modify a combo value
setValue: function(v) {
v = parseInt(v) + " dpi";
Ext.form.ComboBox.prototype.setValue.apply(this, arguments);
}
}, {


xtype: "combo",
store: printProvider.scales,
displayField: "name",
fieldLabel: "Scale",
typeAhead: true,
mode: "local",
triggerAction: "all",
plugins: new GeoExt.plugins.PrintPageField({
printPage: printPage
})
}, {


xtype: "textfield",
name: "rotation",
fieldLabel: "Rotation",
plugins: new GeoExt.plugins.PrintPageField({
printPage: printPage
})
}],
buttons: [{
text: "Create PDF",
handler: function() {
printProvider.print(mapPanel, printPage);
}
}]
});


// The main panel
new Ext.Panel({
renderTo: "content",
layout: "border",
width: 700,
height: 420,
items: [mapPanel, formPanel]
});
});

HTML ファイルを新規作成します。
「openlayersTokyoproj」 を右クリックして 新規 -> HTML ファイル をクリック。
「HTML ファイル」ウィンドウの「ファイル名(任意:geoext27_print-form.html)」に入力して「完了」ボタンをクリック。
「charset」を「utf-8」にします。
以下のように HTML を作成します。
geoext26_print-extent.html をコピーし、外部 JavaScript 読み込みファイルを修正しプリントモジュールを設定し body タグ内にターゲット id を設定します。

---
<title>GeoExt27 Print Configration with a Form</title>
---
<!-- print-form.js 追加 -->
<script type="text/javascript" src="./print-form.js"></script>

<!-- The script below will load the capabilities of the print service
and save them into the global printCapabilities variable. Instead
of this, the PrintProvider can be configured with a url and take
care of fetching the capabilities. -->
<!--
<script type="text/javascript" src="http://demo.opengeo.org/geoserver/pdf/info.json?var=printCapabilities"></script>
-->
<script type="text/javascript" src="http://192.168.1.6:8080/geoserver/pdf/info.json?var=printCapabilities"></script>

</head>


<body>

<h1 id="title">GeoExt 27 - Print Configration with a Form</h1>
<p id="shortdesc">
Advanced Printing with Special Form Fields
</p>
<p>This example shows the how to accomplish advanced printing,
with a form controlling parameters for the MapFish or GeoServer
print module.</p>

<p>この例では、MapFish または GeoServer 印刷モジュールの形式制御パラメータで、
高度な印刷を実現する方法を示しています。</p>

<div id="content"></div>

</body>
</html>


2010年12月17日金曜日

GeoExt26 Interactive Print Extent

Setting the Print Extent on the Map Interactively

Example サイト
http://www.geoext.org/examples.html

「nteractive Print Extent」リンクをクリックすると Setting the Print Extent on the Map Interactively が表示されます。
print-extent.js. を参考にします。

説明を意訳すると、動的な印刷範囲を示す四角形を使って対話形式で印刷可能なPDFの境界を設定する方法を示します。

var mapPanel, printProvider;

Ext.onReady(function() {
// The printProvider that connects us to the print service
printProvider = new GeoExt.data.PrintProvider({
method: "GET", // "POST" recommended for production use
capabilities: printCapabilities, // from the info.json script in the html
customParams: {
mapTitle: "Printing Demo",
comment: "This is a map printed from GeoExt."
}
});

var printExtent = new GeoExt.plugins.PrintExtent({
printProvider: printProvider
});


// The map we want to print, with the PrintExtent added as item.
// 東京都用マップ設定
var map = new OpenLayers.Map('map', {
controls: [
new OpenLayers.Control.PanZoom(),
new OpenLayers.Control.LayerSwitcher(),
new OpenLayers.Control.MousePosition(),
new OpenLayers.Control.ScaleLine()
],
// allOverlays: true,
projection: new OpenLayers.Projection("EPSG:2456"),
maxResolution: 'auto', //'367.1875', '183.594',
maxExtent: new OpenLayers.Bounds(-279000,1054000,-185000,1104000),
units: 'meters',
displayProjection: new OpenLayers.Projection("EPSG:4326")
});


mapPanel = new GeoExt.MapPanel({
renderTo: "content",
width: 450,
height: 320,
// layers: [new OpenLayers.Layer.WMS("Tasmania", "http://demo.opengeo.org/geoserver/wms",
// {layers: "topp:tasmania_state_boundaries"}, {singleTile: true})],
layers: [
// 東京都レイヤ
new OpenLayers.Layer.WMS( "Tokyo Height WMS",
"http://192.168.1.6/cgi-bin/mapserv?",
{
map: '/home/user/mapfile/tokyo_bmi_pgis_img2.map',
layers: 'height',
// isBaselayer: false,
format: 'image/png'
}, {
singleTile: true
}),
new OpenLayers.Layer.WMS( "Tokyo Kukaku Sen WMS",
"http://192.168.1.6/cgi-bin/mapserv?",
{
map: '/home/user/mapfile/tokyo_bmi_pgis_img2.map',
layers: 'kukaku',
transparent: true,
format: 'image/png'
}, {
singleTile: true
})
],
// center: [146.56, -41.56],
// zoom: 6,
map: map,
plugins: [printExtent],
bbar: [{
text: "Create PDF",
handler: function() {
// the PrintExtent plugin is the mapPanel's 1st plugin
mapPanel.plugins[0].print();
}
}]
});
printExtent.addPage();
});


HTML ファイルを新規作成します。
「openlayersTokyoproj」 を右クリックして 新規 -> HTML ファイル をクリック。
「HTML ファイル」ウィンドウの「ファイル名(任意:geoext26_print-extent.html)」に入力して「完了」ボタンをクリック。
「charset」を「utf-8」にします。
以下のように HTML を作成します。
geoext25_print-preview.html をコピーし、外部 JavaScript 読み込みファイルを修正しプリントモジュールを設定し body タグ内にターゲット id を設定します。

---
<title>GeoExt26 Interactive Print Extent</title>
---
<!-- print-extent.js 追加 -->
<script type="text/javascript" src="./print-extent.js"></script>

<!-- The script below will load the capabilities of the print service
and save them into the global printCapabilities variable. Instead
of this, the PrintProvider can be configured with a url and take
care of fetching the capabilities. -->
<!--
<script type="text/javascript" src="http://demo.opengeo.org/geoserver/pdf/info.json?var=printCapabilities"></script>
-->
<script type="text/javascript" src="http://192.168.1.6:8080/geoserver/pdf/info.json?var=printCapabilities"></script>

</head>


<body>

<h1 id="title">GeoExt 26 - Interactive Print Extent</h1>
<p id="shortdesc">
Setting the Print Extent on the Map Interactively
</p>
<p>This example shows how to set the bounds of a printable PDF
interactively with a dynamic print extent rectangle.
It requires the MapFish or GeoServer print module.</p>

<p>Drag one of the handles to control the scale. Grab one of
the corner handles at its edge to rotate the extent. Hold
the SHIFT key to rotate in 45° increments only. Drag the
extent rectangle to change the center.</p>

<p>この例では、動的な印刷範囲を示す四角形を使って対話形式で印刷可能な
PDFの境界を設定する方法を示します。それは MapFish または GeoServer
印刷モジュールが必要です。<p>

<p>スケールを制御するためにハンドルの1つをドラッグします。範囲を
回転するためにそのエッジにあるコーナのハンドルを掴みます。45 °単位で
回転するには、Shiftキーを押し続けるだけます。中心部を変更するには
範囲を示す四角形をドラッグします。</p>

<div id="content"></div>

</body>
</html>


2010年12月16日木曜日

GeoExt25 Print Preview Window

Using a Preview Window

Example サイト
http://www.geoext.org/examples.html

「Print Preview Window」リンクをクリックすると Using a Preview Window が表示されます。
print-preview.js. を参考にします。

説明を意訳すると、GeoExt.data.PrintProvider と GeoExt.data.PrintPage で印刷可能な PDF を作成する方法を示します。

var mapPanel, printDialog;

Ext.onReady(function() {
// The PrintProvider that connects us to the print service
var printProvider = new GeoExt.data.PrintProvider({
method: "GET", // "POST" recommended for production use
capabilities: printCapabilities, // provide url instead for lazy loading
customParams: {
mapTitle: "GeoExt Printing Demo",
comment: "This demo shows how to use GeoExt.PrintMapPanel"
}
});

 
// A MapPanel with a "Print..." button
// 東京都用マップ設定
var map = new OpenLayers.Map('map', {
controls: [
new OpenLayers.Control.PanZoom(),
new OpenLayers.Control.LayerSwitcher(),
new OpenLayers.Control.MousePosition(),
new OpenLayers.Control.ScaleLine()
],
projection: new OpenLayers.Projection("EPSG:2456"),
maxResolution: 'auto', //'367.1875', '183.594',
maxExtent: new OpenLayers.Bounds(-279000,1054000,-185000,1104000),
units: 'meters',
displayProjection: new OpenLayers.Projection("EPSG:4326")
});

 
mapPanel = new GeoExt.MapPanel({
renderTo: "content",
width: 500,
height: 350,
/*
map: {
maxExtent: new OpenLayers.Bounds(
143.835, -43.648,
148.479, -39.574
),
maxResolution: 0.018140625,
projection: "EPSG:4326",
units: 'degrees'
},
*/
map: map,
/*

 
layers: [new OpenLayers.Layer.WMS("Tasmania State Boundaries",
"http://demo.opengeo.org/geoserver/wms",
{layers: "topp:tasmania_state_boundaries"},
{singleTile: true, numZoomLevels: 8})],
*/
layers: [
// 東京都レイヤ
new OpenLayers.Layer.WMS( "Tokyo Height WMS",
"http://192.168.1.6/cgi-bin/mapserv?",
{
map: '/home/user/mapfile/tokyo_bmi_pgis_img2.map',
layers: 'height',
format: 'image/png'
}, {
singleTile: true
}),
new OpenLayers.Layer.WMS( "Tokyo Kukaku Sen WMS",
"http://192.168.1.6/cgi-bin/mapserv?",
{
map: '/home/user/mapfile/tokyo_bmi_pgis_img2.map',
layers: 'kukaku',
transparent: true,
format: 'image/png'
}, {
singleTile: true
})
],
// center: [146.56, -41.56],
// zoom: 0,

 
bbar: [{
text: "Print...",
handler: function(){
// A window with the PrintMapPanel, which we can use to adjust
// the print extent before creating the pdf.
printDialog = new Ext.Window({
title: "Print Preview",
layout: "fit",
width: 350,
autoHeight: true,
items: [{
xtype: "gx_printmappanel",
sourceMap: mapPanel,
printProvider: printProvider
}],
bbar: [{
text: "Create PDF",
handler: function(){ printDialog.items.get(0).print(); }
}]
});
printDialog.show();
}
}]
});

});

HTML ファイルを新規作成します。
「openlayersTokyoproj」 を右クリックして 新規 -> HTML ファイル をクリック。
「HTML ファイル」ウィンドウの「ファイル名(任意:geoext25_print-preview.html)」に入力して「完了」ボタンをクリック。
「charset」を「utf-8」にします。
以下のように HTML を作成します。
geoext24_print-page.html をコピーし、外部 JavaScript 読み込みファイルを修正しプリントモジュールを設定し body タグ内にターゲット id を設定します。
 
---
<title>GeoExt25 Print Preview Window</title>
---
<!-- print-preview.js 追加 -->
<script type="text/javascript" src="./print-preview.js"></script>

<!-- The script below will load the capabilities of the print service
and save them into the global printCapabilities variable. Instead
of this, the PrintProvider can be configured with a url and take
care of fetching the capabilities. -->
<!--
<script type="text/javascript" src="http://demo.opengeo.org/geoserver/pdf/info.json?var=printCapabilities"></script>
-->
<script type="text/javascript" src="http://192.168.1.6:8080/geoserver/pdf/info.json?var=printCapabilities"></script>

</head>

 
<body>

<h1 id="title">GeoExt 25 - Print Preview Window</h1>
<p id="shortdesc">
Using a Preview Window
</p>
<p>This example shows the how to create a printable PDF with
GeoExt.data.PrintProvider and GeoExt.data.PrintPage,
using the MapFish or GeoServer print module.</p>

<p>この例では、MapFish または GeoServer 印刷モジュールを使用して、
GeoExt.data.PrintProvider と GeoExt.data.PrintPage で印刷可能な PDF を
作成する方法を示します。</p>

<div id="content"></div>

</body>
</html>


2010年12月15日水曜日

GeoExt24 Print Your Page

Printing Contents from a MapPanel

Example サイト
http://www.geoext.org/examples.html

「Print Your Page」リンクをクリックすると Printing Contents from a MapPanel が表示されます。
print-page.js. を参考にします。

説明を意訳すると、GeoExt.data.PrintProvider と GeoExt.data.PrintPage で印刷可能な PDF を作成する方法を示します。


初めに、GeoServer Printing Module サイト
http://docs.geoserver.org/stable/en/user/community/printing/

に従って GeoServer プリントモジュールをインストールします。

1 Installation の「nighty build server」をクリックします。
2 geoserver-2.0.3-SNAPSHOT-printing-plugin.zip をクリックしてダウンロードします。
3 2 の ZIP ファイルを /WEB-INF/lib/ に解凍します。
(私の場合は、/home/user/geoserver-2.0.1/webapps/geoserver/WEB-INF/lib/ です)
4 GeoServer を再起動します。
5 http://localhost:8080/geoserver/pdf/info.json で設定されているで印刷プロパティの一覧がダウンロードされるのを確認してください。

var mapPanel, printPage;

Ext.onReady(function() {
// The printProvider that connects us to the print service
var printProvider = new GeoExt.data.PrintProvider({
method: "GET", // "POST" recommended for production use "GET"
capabilities: printCapabilities // from the info.json script in the html
});
// Our print page. Tells the PrintProvider about the scale and center of
// our page.
printPage = new GeoExt.data.PrintPage({
printProvider: printProvider,
customParams: {
mapTitle: "Printing Demo",
comment: "This is a simple map printed from GeoExt."
}
});


// The map we want to print
// 東京都用マップ設定
var map = new OpenLayers.Map('map', {
controls: [
new OpenLayers.Control.PanZoom(),
new OpenLayers.Control.LayerSwitcher(),
new OpenLayers.Control.MousePosition(),
new OpenLayers.Control.ScaleLine()
],
projection: new OpenLayers.Projection("EPSG:2456"),
maxResolution: 'auto', //'367.1875', '183.594',
maxExtent: new OpenLayers.Bounds(-279000,1054000,-185000,1104000),
units: 'meters',
displayProjection: new OpenLayers.Projection("EPSG:4326")
});


mapPanel = new GeoExt.MapPanel({
region: "center",
// layers: [new OpenLayers.Layer.WMS("Tasmania", "http://demo.opengeo.org/geoserver/wms",
// {layers: "topp:tasmania_state_boundaries"}, {singleTile: true})],
layers: [
// 東京都レイヤ
new OpenLayers.Layer.WMS( "Tokyo Height WMS",
"http://192.168.1.6/cgi-bin/mapserv?",
{
map: '/home/user/mapfile/tokyo_bmi_pgis_img2.map',
layers: 'height',
format: 'image/png'
}, {
singleTile: true
}),
new OpenLayers.Layer.WMS( "Tokyo Kukaku Sen WMS",
"http://192.168.1.6/cgi-bin/mapserv?",
{
map: '/home/user/mapfile/tokyo_bmi_pgis_img2.map',
layers: 'kukaku',
transparent: true,
format: 'image/png'
}, {
singleTile: true
})
],
// center: [146.56, -41.56],
// zoom: 7
map: map
});


// The legend to optionally include on the printout
var legendPanel = new GeoExt.LegendPanel({
region: "west",
width: 150,
bodyStyle: "padding:5px",
layerStore: mapPanel.layers
});

var includeLegend; // controlled by the "Include legend?" checkbox

// The main panel
new Ext.Panel({
renderTo: "content",
layout: "border",
width: 700,
height: 420,
items: [mapPanel, legendPanel],
bbar: ["->", {
text: "Print",
handler: function() {
// convenient way to fit the print page to the visible map area
printPage.fit(mapPanel, true);
// print the page, optionally including the legend
printProvider.print(mapPanel, printPage, includeLegend && {legend: legendPanel});
}
}, {
xtype: "checkbox",
boxLabel: "Include legend?",
handler: function() {includeLegend = this.checked}
}]
});
});


HTML ファイルを新規作成します。
「openlayersTokyoproj」 を右クリックして 新規 -> HTML ファイル をクリック。
「HTML ファイル」ウィンドウの「ファイル名(任意:geoext24_print-page.html)」に入力して「完了」ボタンをクリック。
「charset」を「utf-8」にします。
以下のように HTML を作成します。
geoext23_vector-legend.html をコピーし、外部 JavaScript 読み込みファイルを修正しプリントモジュールを設定し body タグ内にターゲット id を設定します。

---
<title>GeoExt24 Print Your Page</title>
---
<!-- print-page.js 追加 -->
<script type="text/javascript" src="./print-page.js"></script>

<!-- The script below will load the capabilities of the print service
and save them into the global printCapabilities variable. Instead
of this, the PrintProvider can be configured with a url and take
care of fetching the capabilities. -->
<!--
<script type="text/javascript" src="http://demo.opengeo.org/geoserver/pdf/info.json?var=printCapabilities"></script>
-->
<script type="text/javascript" src="http://192.168.1.6:8080/geoserver/pdf/info.json?var=printCapabilities"></script>

</head>


<body>

<h1 id="title">GeoExt 24 - Print Your Page</h1>
<p id="shortdesc">
Printing Contents from a MapPanel
</p>
<p>This example shows the how to create a printable PDF with
GeoExt.data.PrintProvider and GeoExt.data.PrintPage,
using the MapFish or GeoServer print module.</p>

<p>この例では、MapFish または GeoServer 印刷モジュールを使用して、
GeoExt.data.PrintProvider と GeoExt.data.PrintPage で印刷可能な PDF を
作成する方法を示します。</p>

<div id="content"></div>

</body>
</html>


2010年12月14日火曜日

GeoExt23 Vector Legend

GeoExt.LegendPanel with Vector Layers

Example サイト
http://www.geoext.org/examples.html

「Vector Legend」リンクをクリックすると GeoExt.LegendPanel with Vector Layers が表示されます。
vector-legend.js. を参考にします。

説明を意訳すると、ベクトルレイヤの凡例を作成する方法で、凡例がスケールの変化に更新される方法を確認します。

var mapPanel, legendPanel;

Ext.onReady(function() {

var rules = [
new OpenLayers.Rule({
title: ">500000人", // "> 2000m",
maxScaleDenominator: 520423, //(Scale Chooser より)3000000,
filter: new OpenLayers.Filter.Comparison({
type: OpenLayers.Filter.Comparison.GREATER_THAN,
property: "total", // "elevation",
value: 500000 // 2000
}),
symbolizer: {
graphicName: "star",
pointRadius: 8,
fillColor: "#99ccff",
strokeColor: "#666666",
strokeWidth: 1
}
}),
new OpenLayers.Rule({
title: "100000 - 500000人", // "1500 - 2000m",
maxScaleDenominator: 520423, // 3000000,
filter: new OpenLayers.Filter.Comparison({
type: OpenLayers.Filter.Comparison.BETWEEN,
property: "total", // "elevation",
upperBoundary: 500000, // 2000,
lowerBoundary: 100000 // 1500
}),
symbolizer: {
graphicName: "star", // 表示できません
pointRadius: 6,
fillColor: "#6699cc",
strokeColor: "#666666",
strokeWidth: 1
}
}),
new OpenLayers.Rule({
title: "<100000人", // "< 1500m",
maxScaleDenominator: 520423, // 3000000,
filter: new OpenLayers.Filter.Comparison({
type: OpenLayers.Filter.Comparison.LESS_THAN,
property: "total", // "elevation",
value: 100000 // 1500
}),
symbolizer: {
graphicName: "star",
pointRadius: 4,
fillColor: "#0033cc",
strokeColor: "#666666",
strokeWidth: 1
}
}),
new OpenLayers.Rule({
title: "All",
minScaleDenominator: 520423, // 3000000,
symbolizer: {
graphicName: "star",
pointRadius: 5,
fillColor: "#99ccff",
strokeColor: "#666666",
strokeWidth: 1
}
})
];


/*
var imagery = new OpenLayers.Layer.WMS(
"Imagery",
"http://maps.opengeo.org/geowebcache/service/wms",
{layers: "bluemarble"},
{displayInLayerSwitcher: false}
);
*/
// 東京都用マップ設定
var map = new OpenLayers.Map('map', {
controls: [
new OpenLayers.Control.PanZoom(),
new OpenLayers.Control.LayerSwitcher(),
new OpenLayers.Control.MousePosition(),
new OpenLayers.Control.ScaleLine()
],
allOverlays: true,
projection: new OpenLayers.Projection("EPSG:2456"),
maxResolution: 'auto',
maxExtent: new OpenLayers.Bounds(-279000,1054000,-185000,1104000),
units: 'meters',
displayProjection: new OpenLayers.Projection("EPSG:4326")
});


// 東京都レイヤ
var layer1 = new OpenLayers.Layer.WMS( "Tokyo Height WMS",
"http://192.168.1.6/cgi-bin/mapserv?",
{
map: '/home/user/mapfile/tokyo_bmi_pgis_img2.map',
layers: 'height',
format: 'image/png'
}, {
displayInLayerSwitcher: false
});
var layer2 = new OpenLayers.Layer.WMS( "Tokyo Kukaku Sen WMS",
"http://192.168.1.6/cgi-bin/mapserv?",
{
map: '/home/user/mapfile/tokyo_bmi_pgis_img2.map',
layers: 'kukaku',
transparent: true,
format: 'image/png'
}, {
displayInLayerSwitcher: false
});


// var summits = new OpenLayers.Layer.Vector("Summits", {
var population = new OpenLayers.Layer.Vector("Population", {
strategies: [new OpenLayers.Strategy.Fixed()],
protocol: new OpenLayers.Protocol.HTTP({
url: "mapserver_gyoseikai.json", // "data/summits.json",
format: new OpenLayers.Format.GeoJSON({
'internalProjection': new OpenLayers.Projection("EPSG:2456"),
'externalProjection': new OpenLayers.Projection("EPSG:4326")
})
}),
styleMap: new OpenLayers.StyleMap(new OpenLayers.Style({}, {rules: rules}))
});


mapPanel = new GeoExt.MapPanel({
renderTo: "mappanel",
border: false,
layers: [layer1,layer2, population],
// center: [6.3, 45.6],
height: 256, // IE6 wants this
// zoom: 8
map: map
});


legendPanel = new GeoExt.LegendPanel({
layerStore: mapPanel.layers,
renderTo: "legend",
border: false
});

});


HTML ファイルを新規作成します。
「openlayersTokyoproj」 を右クリックして 新規 -> HTML ファイル をクリック。
「HTML ファイル」ウィンドウの「ファイル名(任意:geoext23_vector-legend.html)」に入力して「完了」ボタンをクリック。
「charset」を「utf-8」にします。
以下のように HTML を作成します。
geoext22_tree-legend.html をコピーし、外部 JavaScript 読み込みファイルを修正し凡例の文字のスタイルを設定し body タグ内にターゲット id を設定します。

---
<title>GeoExt23 Vector Legend</title>
---
<!-- vector-legend.js 追加 -->
<script type="text/javascript" src="./vector-legend.js"></script>
<!-- MapPanel LegendPanel のスタイル 追加 -->
<style>
#wrapper {
position: relative;
}
#mappanel {
position: absolute;
top: 0px;
left: 0px;
width: 512px;
height: 256px;
}
#legend {
position: absolute;
top: 0px;
left: 550px;
height: 256px;
width: 150px;
}
</style>

</head>


<body>

<h1 id="title">GeoExt 23 - Vector Legend</h1>
<p id="shortdesc">
GeoExt.LegendPanel with Vector Layers
</p>
<p>This example shows the how to create a legend for vector layers.
Zoom out to see how the legend is updated with changes in scale.</p>

<p>この例では、ベクトルレイヤの凡例を作成する方法を示します。
凡例がスケールの変化に更新される方法を確認するためズームアウトしてください。</p>

<div id="wrapper">
<div id="mappanel"></div>
<div id="legend"></div>
</div>

</body>
</html>


データがポリゴンなので面が塗りつぶされます。

2010年12月13日月曜日

GeoExt22 Tree Legend

GeoExt Legend Tree

Example サイト
http://www.geoext.org/examples.html

「Tree Legend」リンクをクリックすると GeoExt Legend Tree が表示されます。
tree-legend.js. を参考にします。

説明を意訳すると、ツリー内のレイヤノードに凡例を追加する方法を示します。

// custom layer node UI class
var LayerNodeUI = Ext.extend(
GeoExt.tree.LayerNodeUI,
new GeoExt.tree.TreeNodeUIEventMixin()
);


Ext.onReady(function() {
// 東京都用マップ設定
var map = new OpenLayers.Map('map', {
controls: [
new OpenLayers.Control.PanZoom(),
new OpenLayers.Control.LayerSwitcher(),
new OpenLayers.Control.MousePosition(),
new OpenLayers.Control.ScaleLine()
],
allOverlays: true,
projection: new OpenLayers.Projection("EPSG:2456"),
maxResolution: 'auto', //'183.594', '367.1875',
maxExtent: new OpenLayers.Bounds(-279000,1054000,-185000,1104000),
units: 'meters',
displayProjection: new OpenLayers.Projection("EPSG:4326")
});


var mapPanel = new GeoExt.MapPanel({
region: "center",
// center: [146.1569825, -41.6109735],
// zoom: 6,
map: map,
layers: [
// 東京都レイヤ
new OpenLayers.Layer.WMS( "Tokyo Kukaku Sen WMS",
"http://192.168.1.6/cgi-bin/mapserv?",
{
map: '/home/user/mapfile/tokyo_bmi_pgis_img2.map',
layers: 'kukaku',
transparent: true,
format: 'image/png'
}, {
buffer: 0,
displayInLayerSwitcher: false
}),
// 新幹線レイヤ
new OpenLayers.Layer.WMS( "Railroad Shinkansen WMS",
"http://192.168.1.6/cgi-bin/mapserv?",
{
map: '/home/user/mapfile/tokyo_pf_pgis.map',
layers: 'shinkansen',
transparent: true,
format: 'image/png'
},{
buffer: 0,
projection: new OpenLayers.Projection("EPSG:4326")
}),
// JR レイヤ
new OpenLayers.Layer.WMS( "Railroad JR Line WMS",
"http://192.168.1.6/cgi-bin/mapserv?",
{
map: '/home/user/mapfile/tokyo_pf_pgis.map',
layers: 'jrline',
transparent: true,
format: 'image/png'
},{
buffer: 0,
projection: new OpenLayers.Projection("EPSG:4326")
}),
// 私鉄 レイヤ
new OpenLayers.Layer.WMS( "Railroad Private Line WMS",
"http://192.168.1.6/cgi-bin/mapserv?",
{
map: '/home/user/mapfile/tokyo_pf_pgis.map',
layers: 'privateline',
transparent: true,
format: 'image/png'
},{
buffer: 0,
projection: new OpenLayers.Projection("EPSG:4326")
})
]
});


var tree = new Ext.tree.TreePanel({
region: "east",
title: "Layers",
width: 250,
autoScroll: true,
enableDD: true,
// apply the tree node component plugin to layer nodes
plugins: [{
ptype: "gx_treenodecomponent"
}],
loader: {
applyLoader: false,
uiProviders: {
"custom_ui": LayerNodeUI
}
},
root: {
nodeType: "gx_layercontainer",
loader: {
baseAttrs: {
uiProvider: "custom_ui"
},
createNode: function(attr) {
// add a WMS legend to each node created
attr.component = {
xtype: "gx_wmslegend",
layerRecord: mapPanel.layers.getByLayer(attr.layer),
showTitle: false,
// custom class for css positioning
// see tree-legend.html
cls: "legend"
}
return GeoExt.tree.LayerLoader.prototype.createNode.call(this, attr);
}
}
},
rootVisible: false,
lines: false
});


new Ext.Viewport({
layout: "fit",
hideBorders: true,
items: {
layout: "border",
items: [
mapPanel, tree, {
contentEl: desc,
region: "west",
width: 250,
bodyStyle: {padding: "5px"}
}
]
}
});
});


HTML ファイルを新規作成します。
「openlayersTokyoproj」 を右クリックして 新規 -> HTML ファイル をクリック。
「HTML ファイル」ウィンドウの「ファイル名(任意:geoext22_tree-legend.html)」に入力して「完了」ボタンをクリック。
「charset」を「utf-8」にします。
以下のように HTML を作成します。
geoext21_legendpanel.html をコピーし、外部 JavaScript 読み込みファイルを修正し凡例の文字のスタイルを設定し body タグ内にターゲット id を設定します。

<title>GeoExt22 Tree Legend</title>
---
<!-- tree-legend.js 追加 -->
<script type="text/javascript" src="./tree-legend.js"></script>
<!-- Viewportのスタイル 追加 -->
<style type="text/css">
.legend {
padding-left: 18px;
}
.x-tree-node-el {
border-bottom: 1px solid #ddd;
padding-bottom: 3px;
}
.x-tree-ec-icon {
width: 3px;
}
.gx-tree-layer-icon {
display: none;
}
</style>

</head>
<body>


<div id="desc">
<h1 id="title">GeoExt 22 - Tree Legend</h1>
<p id="shortdesc">
GeoExt Legend Tree
</p>
<p>This example shows how to add legends to the layer nodes in a tree.</p>

<p>この例では、ツリー内のレイヤノードに凡例を追加する方法を示します。</p>
</div>

</body>
</html>


マップファイルの LAYER の CLASS NAME と STYLE が凡例に使われています。

2010年12月9日木曜日

GeoExt21 GeoExt.LegendPanel

GeoExt.LegendPanel

Example サイト
http://www.geoext.org/examples.html

「Legend Panel」リンクをクリックすると GeoExt.LegendPanel が表示されます。
legendpanel.js. を参考にします。

説明を意訳すると、マップから凡例を自動表示して LegendPanel を作成する方法を示します。

var mapPanel, legendPanel;

Ext.onReady(function() {
// var map = new OpenLayers.Map({allOverlays: true});
// 東京都用マップ設定
var map = new OpenLayers.Map('map', {
allOverlays: true,
projection: new OpenLayers.Projection("EPSG:2456"),
maxResolution: 'auto', //, '367.1875','183.594'
maxExtent: new OpenLayers.Bounds(-279000,1054000,-185000,1104000),
units: 'meters',
displayProjection: new OpenLayers.Projection("EPSG:4326")
});


map.addLayers([
/*
new OpenLayers.Layer.WMS(
"Tasmania",
"http://demo.opengeo.org/geoserver/wms?",
{layers: 'topp:tasmania_state_boundaries', format: 'image/png', transparent: true},
{singleTile: true}),
new OpenLayers.Layer.WMS(
"Cities and Roads",
"http://demo.opengeo.org/geoserver/wms?",
{layers: 'topp:tasmania_cities,topp:tasmania_roads', format: 'image/png', transparent: true},
{singleTile: true}),
*/


// 東京都レイヤ
new OpenLayers.Layer.WMS( "Tokyo Kukaku Sen WMS",
"http://192.168.1.6/cgi-bin/mapserv?",
{
map: '/home/nob61/mapfile/tokyo_bmi_pgis_img2.map',
layers: 'kukaku',
transparent: true,
format: 'image/png'
}),
// 新幹線レイヤ
new OpenLayers.Layer.WMS( "Railroad Shinkansen WMS",
"http://192.168.1.6/cgi-bin/mapserv?",
{
map: '/home/nob61/mapfile/tokyo_pf_pgis.map',
layers: 'shinkansen',
transparent: true,
format: 'image/png'
},{
projection: new OpenLayers.Projection("EPSG:4326")
}
),
// ベクタフィーチャレイヤ
new OpenLayers.Layer.Vector('Polygons', {styleMap: new OpenLayers.StyleMap({
"default": new OpenLayers.Style({
pointRadius: 8,
fillColor: "#00ffee",
strokeColor: "#000000",
strokeWidth: 2
}) }) })
]);


// プロジェクションの変更
var proj1 = new OpenLayers.Projection("EPSG:4326");
var proj2 = new OpenLayers.Projection("EPSG:2456");
var polygon = OpenLayers.Geometry.fromWKT(
"POLYGON(139.4 35.7, 139.45 35.7, 139.45 35.75, 139.4 35.75)"
);
polygon.transform(proj1, proj2);
map.layers[2].addFeatures([
// new OpenLayers.Feature.Vector(OpenLayers.Geometry.fromWKT(
// "POLYGON(146.1 -41, 146.2 -41, 146.2 -41.1, 146.1 -41.1)"))
new OpenLayers.Feature.Vector(polygon) // 修正
]);
map.addControl(new OpenLayers.Control.LayerSwitcher());
map.addControl(new OpenLayers.Control.MousePosition()); // 追加
map.addControl(new OpenLayers.Control.ScaleLine()); // 追加


// JR レイヤの追加と削除
var addRemoveLayer = function() {
//if(mapPanel.map.layers.indexOf(water) == -1) {
// mapPanel.map.addLayer(water);
if(mapPanel.map.layers.indexOf(jrline) == -1) {
mapPanel.map.addLayer(jrline);
} else {
// mapPanel.map.removeLayer(water);
mapPanel.map.removeLayer(jrline);
}
};
// 第1レイヤ(kukaku)の移動(投影法のエラーになります)
var moveLayer = function(idx) {
var layer = layerRec0.getLayer();
var idx = mapPanel.map.layers.indexOf(layer) == 0 ?
mapPanel.map.layers.length : 0;
mapPanel.map.setLayerIndex(layerRec0.getLayer(), idx);
};
// 第2レイヤ(shinkansen)の表示と非表示
var toggleVisibility = function() {
var layer = layerRec1.getLayer();
layer.setVisibility(!layer.getVisibility());
};
// 第1レイヤの凡例の表示と非表示
var updateHideInLegend = function() {
layerRec0.set("hideInLegend", !layerRec0.get("hideInLegend"));
};
// 第1レイヤの凡例の画像変更
var updateLegendUrl = function() {
var url = layerRec0.get("legendURL");
layerRec0.set("legendURL", otherUrl);
otherUrl = url;
};


mapPanel = new GeoExt.MapPanel({
region: 'center',
height: 400,
width: 600,
map: map //,
// center: new OpenLayers.LonLat(146.4, -41.6),
// zoom: 7
});


// give the record of the 1st layer a legendURL, which will cause
// UrlLegend instead of WMSLegend to be used
var layerRec0 = mapPanel.layers.getAt(0);
// layerRec0.set("legendURL", "http://demo.opengeo.org/geoserver/wms?FORMAT=image%2Fgif&TRANSPARENT=true&SERVICE=WMS&VERSION=1.1.1&REQUEST=GetLegendGraphic&EXCEPTIONS=application%2Fvnd.ogc.se_xml&LAYER=topp%3Atasmania_state_boundaries");
layerRec0.set("legendURL", "http://192.168.1.6/cgi-bin/mapserv?map=/home/nob61/mapfile/tokyo_bmi_pgis_img2.map&FORMAT=image%2Fpng&TRANSPARENT=true&SERVICE=WMS&VERSION=1.1.1&REQUEST=GetLegendGraphic&EXCEPTIONS=application%2Fvnd.ogc.se_xml&LAYER=kukaku");

// store the layer that we will modify in toggleVis()
var layerRec1 = mapPanel.layers.getAt(1);

// stores another legendURL for the legendurl button action
var otherUrl = "http://www.geoext.org/trac/geoext/chrome/site/img/GeoExt.png";


// create another layer for the add/remove button action
/*
var water = new OpenLayers.Layer.WMS("Bodies of Water",
"http://demo.opengeo.org/geoserver/wms?",
{layers: 'topp:tasmania_water_bodies', format: 'image/png', transparent: true},
{singleTile: true}
);
*/
// JR レイヤ
var jrline = new OpenLayers.Layer.WMS( "Railroad JR Line WMS",
"http://192.168.1.6/cgi-bin/mapserv?",
{
map: '/home/nob61/mapfile/tokyo_pf_pgis.map',
layers: 'jrline',
transparent: true,
format: 'image/png'
},{
projection: new OpenLayers.Projection("EPSG:4326"),
singleTile: true
}
);


legendPanel = new GeoExt.LegendPanel({
defaults: {
labelCls: 'mylabel',
style: 'padding:5px'
},
bodyStyle: 'padding:5px',
// width: 350,
width: 200, // mapPanel の width よりもこちらが優先されるので Ext.Panel の width に合わせるため修正。
autoScroll: true,
region: 'west'
});


new Ext.Panel({
title: "GeoExt LegendPanel Demo",
layout: 'border',
renderTo: 'view',
height: 400,
width: 800,
tbar: new Ext.Toolbar({
items: [
{text: 'add/remove', handler: addRemoveLayer},
{text: 'movetop/bottom', handler: moveLayer },
{text: 'togglevis', handler: toggleVisibility},
{text: 'hide/show', handler: updateHideInLegend},
{text: 'legendurl', handler: updateLegendUrl}
]
}),
items: [legendPanel, mapPanel]
});
});

HTML ファイルを新規作成します。
「openlayersTokyoproj」 を右クリックして 新規 -> HTML ファイル をクリック。
「HTML ファイル」ウィンドウの「ファイル名(任意:geoext21_legendpanel.html)」に入力して「完了」ボタンをクリック。
「charset」を「utf-8」にします。
以下のように HTML を作成します。
geoext20_zoomslider.html をコピーし、外部 JavaScript 読み込みファイルを修正し凡例の文字のスタイルを設定し body タグ内にターゲット id を設定します。

<title>GeoExt21 Legend Panel</title>
---
<!-- legendpanel.js 追加 -->
<script type="text/javascript" src="./legendpanel.js"></script>
<!-- 凡例の文字のスタイル 追加 -->
<style type="text/css">
.mylabel {
font-weight: bold;
color: red;
}
</style>

</head>
<body>
<h1 id="title">GeoExt 21 - Legend Panel</h1>
<p id="shortdesc">
GeoExt.LegendPanel
</p>
<p>This example shows the how to create a LegendPanel that autopopulates
with legends from a map that has already been created.</p>

<p>この例では、既に作成されているマップから凡例を自動表示する LegendPanel を
作成する方法を示します。</p>

<div id="view"></div>

</body>
</html>


MapServer の WMS で、map の投影法が EPSG:2456 のためにオプション('unit' が 'meter' など)を設定したとき、マップの表示サイズ(今回は GeoExt.MapPanel のサイズ)でズームが自動的に決定されるので、表示できない倍率になることがあります。ここの東京都の地図は height と width の比が 2:3 になっているのでマップの表示サイズもこれに合わせるようにしました。

2010年12月8日水曜日

GeoExt20 GeoExt.ZoomSlider

GeoExt.ZoomSlider

Example サイト
http://www.geoext.org/examples.html

「Zoom Slider」リンクをクリックすると GeoExt.ZoomSlider が表示されます。
zoomslider.js. を参考にします。

説明を意訳すると、Ext.Slider を使用してマップスケールの制御をする方法を示します。

var panel, slider;

Ext.onReady(function() {

// create a map panel with an embedded slider
// 東京都用マップ設定
var map = new OpenLayers.Map('map', {
controls: [
// new OpenLayers.Control.PanZoom(),
new OpenLayers.Control.Navigation(),
new OpenLayers.Control.LayerSwitcher(),
new OpenLayers.Control.MousePosition(),
new OpenLayers.Control.ScaleLine()
],
projection: new OpenLayers.Projection("EPSG:2456"),
maxResolution: 'auto',
maxExtent: new OpenLayers.Bounds(-279000,1054000,-185000,1104000),
minResolution: 'auto',
minExtent: new OpenLayers.Bounds(-27900,105400,-18500,110400),
units: 'meters',
displayProjection: new OpenLayers.Projection("EPSG:4326")
});


panel = new GeoExt.MapPanel({
title: "Map",
renderTo: "map-container",
height: 300,
width: 400,
/*
map: {
controls: [new OpenLayers.Control.Navigation()]
},
*/
map: map,
/*
layers: [new OpenLayers.Layer.WMS(
"Global Imagery",
"http://maps.opengeo.org/geowebcache/service/wms",
{layers: "bluemarble"}
)],
extent: [-5, 35, 15, 55],
*/
layers: [
new OpenLayers.Layer.WMS( "Tokyo Height WMS",
"http://192.168.1.6/cgi-bin/mapserv?",
{
map: '/home/nob61/mapfile/tokyo_bmi_pgis_img2.map',
layers: 'height',
format: 'image/png'
}),
new OpenLayers.Layer.WMS( "Tokyo Kukaku Sen WMS",
"http://192.168.1.6/cgi-bin/mapserv?",
{
map: '/home/nob61/mapfile/tokyo_bmi_pgis_img2.map',
layers: 'kukaku',
transparent: true,
format: 'image/png'
})
],
items: [{
xtype: "gx_zoomslider",
vertical: true,
height: 100,
x: 10,
y: 20,
plugins: new GeoExt.ZoomSliderTip()
}]
});


// create a separate slider bound to the map but displayed elsewhere
slider = new GeoExt.ZoomSlider({
map: panel.map,
aggressive: true,
width: 200,
plugins: new GeoExt.ZoomSliderTip({
template: "<div>Zoom Level: {zoom}</div>"
}),
renderTo: document.body
});

});


HTML ファイルを新規作成します。
「openlayersTokyoproj」 を右クリックして 新規 -> HTML ファイル をクリック。
「HTML ファイル」ウィンドウの「ファイル名(任意:geoext20_zoomslider.html)」に入力して「完了」ボタンをクリック。
「charset」を「utf-8」にします。
以下のように HTML を作成します。
geoext19_zoom-chooser.html をコピーし、外部 JavaScript 読み込みファイルを修正し body タグ内にターゲット id を設定します。

---
<title>GeoExt20 Zoom Slider</title>
---
<!-- zoomslider.js 追加 -->
<script type="text/javascript" src="./zoomslider.js"></script>

</head>
<body>
<h1 id="title">GeoExt 20 - Zoom Slider</h1>
<p id="shortdesc">
GeoExt.ZoomSlider
</p>
<p>The ZoomSlider allows control of the map scale using an Ext.Slider.
It is also possible to add a special tooltip plugin, ZoomSliderTip,
which will show the zoom level, scale and resolution while dragging
the slider (the content is configurable).</p>

<p>ZoomSlider は Ext.Slider を使用してマップスケールの制御をすることができます。
スライダをドラッグしながらレベル、スケールと解像度を表示(内容は変更可能)する、
特殊なツールチッププラグイン ZoomSliderTip を追加することも可能です。</p>

<div id="map-container"></div>

</body>
</html>


倍率が自動的に10段階になり高倍率になると拡大しすぎるので、最小範囲を設定してみました。
最小範囲を最大範囲の10分の1にしてみましたが、倍率は3段階になりました。

2010年12月7日火曜日

GeoExt19 GeoExt.data.ScaleStore with an Existing OpenLayers.Map

GeoExt.data.ScaleStore with an Existing OpenLayers.Map

Example サイト
http://www.geoext.org/examples.html

「Zoom Chooser」リンクをクリックすると GeoExt.data.ScaleStore with an Existing OpenLayers.Map が表示されます。
zoom-chooser.js. を参考にします。

説明を意訳すると、マップで有効なズームレベルをリスト表示する GeoExt.data.ScaleStore の使用方法を示します。

var mapPanel;

Ext.onReady(function() {
// var map = new OpenLayers.Map();
// 東京都用マップ設定
var map = new OpenLayers.Map('map', {
controls: [
new OpenLayers.Control.PanZoom(),
new OpenLayers.Control.LayerSwitcher(),
new OpenLayers.Control.MousePosition(),
new OpenLayers.Control.ScaleLine()
],
allOverlays: true,
projection: new OpenLayers.Projection("EPSG:2456"),
maxResolution: 'auto',
maxExtent: new OpenLayers.Bounds(-279000,1054000,-185000,1104000),
units: 'meters',
displayProjection: new OpenLayers.Projection("EPSG:4326")
});


/* レイヤの変更
var layer = new OpenLayers.Layer.WMS(
"Global Imagery",
"http://maps.opengeo.org/geowebcache/service/wms",
{layers: "bluemarble"}
);
*/
var layer1 = new OpenLayers.Layer.WMS( "Tokyo Height WMS",
"http://192.168.1.6/cgi-bin/mapserv?",
{
map: '/home/nob61/mapfile/tokyo_bmi_pgis_img2.map',
layers: 'height',
format: 'image/png'
});
var layer2 = new OpenLayers.Layer.WMS( "Tokyo Kukaku Sen WMS",
"http://192.168.1.6/cgi-bin/mapserv?",
{
map: '/home/nob61/mapfile/tokyo_bmi_pgis_img2.map',
layers: 'kukaku',
transparent: true,
format: 'image/png'
})
map.addLayers([layer1, layer2]);


var scaleStore = new GeoExt.data.ScaleStore({map: map});
// 利用可能なズームレベルのキャッシュが含まれているストア
var zoomSelector = new Ext.form.ComboBox({
store: scaleStore,
emptyText: "Zoom Level",
tpl: '<tpl for="."><div class="x-combo-list-item">1 : {[parseInt(values.scale)]}</div></tpl>',
editable: false,
triggerAction: 'all', // needed so that the combo box doesn't filter by its current content
mode: 'local' // keep the combo box from forcing a lot of unneeded data refreshes
});


zoomSelector.on('select',
function(combo, record, index) {
map.zoomTo(record.data.level);
},
this
);


map.events.register('zoomend', this, function() {
var scale = scaleStore.queryBy(function(record){
return this.map.getZoom() == record.data.level;
});

if (scale.length > 0) {
scale = scale.items[0];
zoomSelector.setValue("1 : " + parseInt(scale.data.scale));
} else {
if (!zoomSelector.rendered) return;
zoomSelector.clearValue();
}
});


mapPanel = new GeoExt.MapPanel({
title: "GeoExt MapPanel",
renderTo: "mappanel",
height: 400,
width: 600,
map: map,
// center: new OpenLayers.LonLat(5, 45),
// zoom: 4,
bbar: [zoomSelector]
});
});

HTML ファイルを新規作成します。
「openlayersTokyoproj」 を右クリックして 新規 -> HTML ファイル をクリック。
「HTML ファイル」ウィンドウの「ファイル名(任意:geoext19_zoom-chooser.html)」に入力して「完了」ボタンをクリック。
「charset」を「utf-8」にします。
以下のように HTML を作成します。
geoext18_layeropacityslider.html をコピーし、外部 JavaScript 読み込みファイルを修正しマップのスタイルシートを修正し body タグ内にターゲット id を設定します。

---
<title>GeoExt19 Zoom Chooser</title>
---
<!-- zoom-chooser.js 追加 -->
<script type="text/javascript" src="./zoom-chooser.js"></script>

</head>
<body>
<h1 id="title">GeoExt 19 - Zoom Chooser</h1>
<p id="shortdesc">
GeoExt.data.ScaleStore with an Existing OpenLayers.Map
</p>
<p>This example demonstrates the use of a GeoExt.data.ScaleStore to list
the available zoom levels for a map.</p>

<p>この例では、マップで有効なズームレベルをリスト表示す GeoExt.data.ScaleStore
の使用方法を示します。</p>

<div id="mappanel"></div>

</body>
</html>


倍率 520423 より縮小(数値では大きく)すると地図が表示されません。
解像度が合わないためと思われます。

2010年12月6日月曜日

GeoExt18 GeoExt.LayerOpacitySlider

GeoExt.LayerOpacitySlider

Example サイト
http://www.geoext.org/examples.html

「Layer Opacity Slider」リンクをクリックすると GeoExt.LayerOpacitySlider が表示されます。
layeropacityslider.js. を参考にします。

説明を意訳すると、LayerOpacitySlider は Ext.Slider を使用してレイヤーの不透明度の制御をする方法を示します。

var panel1, panel2, wms, slider;

Ext.onReady(function() {
// 東京都用マップ設定
option = {
controls: [ // PanZoom コントロールパネルを非表示
new OpenLayers.Control.Navigation(),
new OpenLayers.Control.LayerSwitcher(),
new OpenLayers.Control.MousePosition(),
new OpenLayers.Control.ScaleLine()
],
projection: new OpenLayers.Projection("EPSG:2456"),
maxResolution: 'auto',
maxExtent: new OpenLayers.Bounds(-279000,1054000,-185000,1104000),
units: 'meters',
displayProjection: new OpenLayers.Projection("EPSG:4326")
};


var map = new OpenLayers.Map('map', option);
/* レイヤの変更
wms = new OpenLayers.Layer.WMS(
"Global Imagery",
"http://maps.opengeo.org/geowebcache/service/wms",
{layers: "bluemarble"}
);
*/
wms = new OpenLayers.Layer.WMS( "Tokyo Height WMS",
"http://192.168.1.6/cgi-bin/mapserv?",
{
map: '/home/nob61/mapfile/tokyo_bmi_pgis_img2.map',
layers: 'height',
format: 'image/png'
});


// create a map panel with an embedded slider
panel1 = new GeoExt.MapPanel({
title: "Map 1",
renderTo: "map1-container",
height: 300,
width: 400,
/*
map: {
controls: [new OpenLayers.Control.Navigation()]
},
*/
layers: [wms],
// extent: [-5, 35, 15, 55],
map: map,
items: [{
xtype: "gx_opacityslider",
layer: wms, // opacity 効果対象レイヤ
vertical: true, // 縦表示
height: 120, // 長さ
x: 10, // マップパネル内での位置
y: 10,
plugins: new GeoExt.LayerOpacitySliderTip({template: '<div>Opacity: {opacity}%</div>'})
}]
});
// create a separate slider bound to the map but displayed elsewhere
slider = new GeoExt.LayerOpacitySlider({
layer: wms,
aggressive: true, // 即時効果
width: 200,
isFormField: true,
inverse: true, // 透明度表示
fieldLabel: "opacity",
renderTo: "slider",
plugins: new GeoExt.LayerOpacitySliderTip({template: '<div>Transparency: {opacity}%</div>'})
});


option2 = { // map を別に設定、コントロールの連動を防ぐため
controls: [
new OpenLayers.Control.Navigation(),
new OpenLayers.Control.LayerSwitcher(),
new OpenLayers.Control.MousePosition(),
new OpenLayers.Control.ScaleLine()
],
allOverlays: true,
projection: new OpenLayers.Projection("EPSG:2456"),
maxResolution: 'auto',
maxExtent: new OpenLayers.Bounds(-279000,1054000,-185000,1104000),
units: 'meters',
displayProjection: new OpenLayers.Projection("EPSG:4326")
};


// var option2 = option;
var map2 = new OpenLayers.Map('map2', option2);
var clone = wms.clone();
/* レイヤの変更
var wms2 = new OpenLayers.Layer.WMS(
"OpenLayers WMS",
"http://vmap0.tiles.osgeo.org/wms/vmap0",
{layers: 'basic'}
);
*/
var wms2 = new OpenLayers.Layer.WMS( "Tokyo Kukaku Sen WMS",
"http://192.168.1.6/cgi-bin/mapserv?",
{
map: '/home/nob61/mapfile/tokyo_bmi_pgis_img2.map',
layers: 'kukaku',
transparent: true,
format: 'image/png'
})

panel2 = new GeoExt.MapPanel({
title: "Map 2",
renderTo: "map2-container",
height: 300,
width: 400,
/*
map: {
controls: [new OpenLayers.Control.Navigation()]
},
*/
layers: [wms2, clone],
// layers: [wms2],
// extent: [-5, 35, 15, 55],
map: map2,
items: [{
xtype: "gx_opacityslider",
layer: clone,
complementaryLayer: wms2, // 2つのレイヤのうちスライダが最大で不透明度 0% のレイヤ
changeVisibility: true, // 可視性がスライダに完全に依存。スライダが最小で不透明度 0%
aggressive: true,
vertical: true,
height: 120,
x: 10,
y: 10,
plugins: new GeoExt.LayerOpacitySliderTip()
}]
});


var tree = new Ext.tree.TreePanel({
width: 145,
height: 300,
renderTo: "tree",
root: new GeoExt.tree.LayerContainer({
layerStore: panel2.layers,
expanded: true
})
});

});

HTML ファイルを新規作成します。
「openlayersTokyoproj」 を右クリックして 新規 -> HTML ファイル をクリック。
「HTML ファイル」ウィンドウの「ファイル名(任意:geoext18_layeropacityslider.html)」に入力して「完了」ボタンをクリック。
「charset」を「utf-8」にします。
以下のように HTML を作成します。
geoext17_popup-more.html をコピーし、外部 JavaScript 読み込みファイルを修正しマップのスタイルシートを修正し body タグ内にターゲット id を設定します。

---
<title>GeoExt18 Layer Opacity Slider</title>
---
<!-- layeropacityslider.js 追加 -->
<script type="text/javascript" src="./layeropacityslider.js"></script>
<!-- スタイルシート追加 -->
<style type="text/css">
.x-tree-node-leaf .gx-tree-layer-icon {
width: 0px;
}
</style>

</head>
<body>
<h1 id="title">GeoExt 18 - Layer Opacity Slider</h1>
<p id="shortdesc">
GeoExt.LayerOpacitySlider
</p>
<p>The LayerOpacitySlider allows control of a layer opacity using an Ext.Slider.
It is also possible to add a special tooltip plugin, LayerOpacitySliderTip,
which will show the opacity value while dragging the slider
(the content is configurable).</p>

<p>In this example, the slider in below the map is in aggressive mode:
the opacity is changed as soon as the slider is moved.
The slider inside Map 1 is not aggressive: the opacity is changed when the slider
is released. Also, the slider below the map is an inverse slider, which means it
uses transparency instead of opacity.</p>

<p>In Map 2 we have a fading effect between two layers. The slider is configured
with changeVisibility:true and a complementaryLayer. This avoids downloading images
when layer opacity is 0 or when complementaryLayer is fully covered by layer.
The effect on layer visibility is shown in the tree (checkboxes).</p>

<p>LayerOpacitySlider は Ext.Slider を使用してレイヤーの不透明度の制御をすることができます。
特殊なツールチッププラグイン LayerOpacitySliderTip を追加することも可能で、これは、スライダを
ドラッグしながら不透明度の値を表します(内容は変更可能です)。</p>

<p>この例では、地図の下のスライダは、プログレシブモードになっています: スライダを動かすと不透明度が
すぐに変更されます。地図1内のスライダはプログレシブ(積極的)ではありません:不透明度はスライダーを
はなしたときに変更されます。また、マップの下のスライダは、不透明度の代わりに透明度を使用した逆の
スライダーです。</p>

<p>地図2では、2つのレイヤの間にフェード効果を持っています。スライダが changeVisibility:true
および complementaryLayer が設定されています。これはレイヤーの不透明度が 0 のとき、または
complementaryLayer が完全にレイヤで覆われているとき、画像をダウンロードすることを避けることが
できます。レイヤーの可視性への影響は、ツリー(チェックボックス)で表示されます。</p>

<div id="map1-container" style="float:left"></div>
<div id="map2-container" style="float:right"></div>
<div id="tree" style="float:right"></div>
<div id="slider" style="clear:both"></div>
</body>
</html>

2010年12月5日日曜日

GeoExt17 Modified Popup Example

Modified Popu Example

Example サイト
http://www.geoext.org/examples.html

「Modifying Popups」リンクをクリックすると Modified Popup Example が表示されます。
popup-more.js. を参考にします。

説明を意訳すると、複数の場所(位置)のコンテンツを表示する単一のポップアップの使用方法を示します。

var mapPanel, popup;

Ext.onReady(function() {

function addToPopup(loc) {

// create the popup if it doesn't exist
if (!popup) {
popup = new GeoExt.Popup({
title: "Popup",
width: 200,
maximizable: true,
collapsible: true,
map: mapPanel.map,
anchored: true,
listeners: {
close: function() {
// closing a popup destroys it, but our reference is truthy
popup = null;
}
}
});
}


// プロジェクションの変更
var proj2 = new OpenLayers.Projection("EPSG:4326");
loc.transform(map.getProjectionObject(), proj2); // 数値表示のための投影法の変更

// add some content to the popup (this can be any Ext component)
popup.add({
xtype: "box",
autoEl: {
html: "You clicked on (" + loc.lon.toFixed(2) + ", " + loc.lat.toFixed(2) + ")"
}
});


// reset the popup's location
loc.transform(proj2, map.getProjectionObject()); // 表示位置のため投影法を元に戻す
popup.location = loc;

popup.doLayout();

// since the popup is anchored, calling show will move popup to this location
popup.show();
}


// 東京都用マップ設定
var map = new OpenLayers.Map('map', {
controls: [
new OpenLayers.Control.PanZoom(),
new OpenLayers.Control.LayerSwitcher(),
new OpenLayers.Control.MousePosition(),
new OpenLayers.Control.ScaleLine()
],
projection: new OpenLayers.Projection("EPSG:2456"),
maxResolution: 'auto', //'367.1875', '183.594'
maxExtent: new OpenLayers.Bounds(-279000,1054000,-185000,1104000),
units: 'meters',
displayProjection: new OpenLayers.Projection("EPSG:4326")
});


// create Ext window including a map panel
var mapPanel = new GeoExt.MapPanel({
title: "Map",
renderTo: "container",
width: 650, height: 356,
layers: [
/* レイヤを変更
new OpenLayers.Layer.WMS(
"Global Imagery",
"http://maps.opengeo.org/geowebcache/service/wms",
{layers: "bluemarble"}
)
*/
new OpenLayers.Layer.WMS( "Tokyo Height WMS",
"http://192.168.1.6/cgi-bin/mapserv?",
{
map: '/home/nob61/mapfile/tokyo_bmi_pgis_img2.map',
layers: 'height',
format: 'image/png'
}),
new OpenLayers.Layer.WMS( "Tokyo Kukaku Sen WMS",
"http://192.168.1.6/cgi-bin/mapserv?",
{
map: '/home/nob61/mapfile/tokyo_bmi_pgis_img2.map',
layers: 'kukaku',
transparent: true,
format: 'image/png'
})
],
// center: [0, 0],
// zoom: 2
map: map
});


var control = new OpenLayers.Control.Click({
trigger: function(evt) {
var loc = mapPanel.map.getLonLatFromViewPortPx(evt.xy);
addToPopup(loc);
}
});

mapPanel.map.addControl(control);
control.activate();

});


// simple control to handle user clicks on the map

OpenLayers.Control.Click = OpenLayers.Class(OpenLayers.Control, {
defaultHandlerOptions: {
single: true,
double: false,
pixelTolerance: 0,
stopSingle: true
},

initialize: function(options) {
this.handlerOptions = OpenLayers.Util.extend(
options && options.handlerOptions || {},
this.defaultHandlerOptions
);
OpenLayers.Control.prototype.initialize.apply(
this, arguments
);
this.handler = new OpenLayers.Handler.Click(
this,
{
click: this.trigger
},
this.handlerOptions
);
},
CLASS_NAME: "OpenLayers.Control.Click"
});

HTML ファイルを新規作成します。
「openlayersTokyoproj」 を右クリックして 新規 -> HTML ファイル をクリック。
「HTML ファイル」ウィンドウの「ファイル名(任意:geoext17_popup-more.html)」に入力して「完了」ボタンをクリック。
「charset」を「utf-8」にします。
以下のように HTML を作成します。
geoext16_popup.html をコピーし、外部 JavaScript 読み込みファイルを修正しマップのスタイルシートを修正し body タグ内に container を設定します。

---
<title>GeoExt17 Modified Popup</title>
---
<!-- popup-more.js 追加 -->
<script type="text/javascript" src="./popup-more.js"></script>
<!-- map スタイルシート追加 -->
<style type="text/css">
#container {
margin: 1em;
}
</style>

</head>
<body>
<h1 id="title">GeoExt 17 - Modified Popupp</h1>
<p id="shortdesc">
Modified Popup Example
</p>
<p>This example demonstrates the use of a single popup to display
content from multiple locations.<br />
Clicking on the map will open a popup displaying the click location.
Subsequent clicks will update the content and the position.
Close the popup to start over.</p>

<p>この例では、複数の場所(位置)のコンテンツを表示する単一のポップアップの使用方法を示します。<br />
地図をクリックすると、クリック位置を表示するポップアップを開きます。
続けてクリックするとコンテンツと位置を更新(追加)します。最初からやり直すにポップアップを閉じます。</p>
<div id="container"></div>
</body>
</html>

2010年12月2日木曜日

GeoExt16 Popup Example

Popup Example

Example サイト
http://www.geoext.org/examples.html

「Popup Example」リンクをクリックすると Popup Example が表示されます。
popup.js. を参考にします。

説明を意訳すると、マップパネル上でポイントをクリックしてポップアップを開く方法を示します。

var mapPanel, popup;

Ext.onReady(function() {

// 東京都用マップ設定
var map = new OpenLayers.Map('map', {
controls: [
new OpenLayers.Control.PanZoom(),
new OpenLayers.Control.LayerSwitcher(),
new OpenLayers.Control.MousePosition(),
new OpenLayers.Control.ScaleLine()
],
projection: new OpenLayers.Projection("EPSG:2456"),
maxResolution: 'auto',
maxExtent: new OpenLayers.Bounds(-279000,1054000,-185000,1104000),
units: 'meters',
displayProjection: new OpenLayers.Projection("EPSG:4326")
});


// create a vector layer, add a feature into it
var vectorLayer = new OpenLayers.Layer.Vector("vector");

// プロジェクションの変更
var proj1 = new OpenLayers.Projection("EPSG:4326");
var proj2 = new OpenLayers.Projection("EPSG:2456");
var point = new OpenLayers.Geometry.Point(139.4, 35.7);
point.transform(proj1, proj2);

vectorLayer.addFeatures(
new OpenLayers.Feature.Vector(
// new OpenLayers.Geometry.Point(-45, 5)
point// 修正
)
);


// create select feature control
var selectCtrl = new OpenLayers.Control.SelectFeature(vectorLayer);

// define "createPopup" function
// var bogusMarkup = "Lorem ipsum dolor sit amet, consectetuer adipiscing elit.";
var bogusMarkup = "立川駅南口付近";
function createPopup(feature) {
popup = new GeoExt.Popup({
title: 'My Popup',
location: feature,
width:200,
html: bogusMarkup,
maximizable: true,
collapsible: true
});
// unselect feature when the popup
// is closed
popup.on({
close: function() {
if(OpenLayers.Util.indexOf(vectorLayer.selectedFeatures,
this.feature) > -1) {
selectCtrl.unselect(this.feature);
}
}
});
popup.show();
}


// create popup on "featureselected"
vectorLayer.events.on({
featureselected: function(e) {
createPopup(e.feature);
}
});


// create Ext window including a map panel
var mapwin = new Ext.Window({
layout: "fit",
title: "Map",
closeAction: "hide",
width: 650,
height: 356,
x: 50,
y: 100,
items: {
xtype: "gx_mappanel",
region: "center",
layers: [
/* レイヤを変更
new OpenLayers.Layer.WMS(
"OpenLayers WMS",
"http://vmap0.tiles.osgeo.org/wms/vmap0",
{layers: 'basic'}
),
*/
new OpenLayers.Layer.WMS( "Tokyo Height WMS",
"http://192.168.1.6/cgi-bin/mapserv?",
{
map: '/home/nob61/mapfile/tokyo_bmi_pgis_img2.map',
layers: 'height',
format: 'image/png'
}),
new OpenLayers.Layer.WMS( "Tokyo Kukaku Sen WMS",
"http://192.168.1.6/cgi-bin/mapserv?",
{
map: '/home/nob61/mapfile/tokyo_bmi_pgis_img2.map',
layers: 'kukaku',
transparent: true,
format: 'image/png'
}),
vectorLayer
],
map: map // 追加
}
});
mapwin.show();

mapPanel = mapwin.items.get(0);
mapPanel.map.addControl(selectCtrl);
selectCtrl.activate();
});


HTML ファイルを新規作成します。
「openlayersTokyoproj」 を右クリックして 新規 -> HTML ファイル をクリック。
「HTML ファイル」ウィンドウの「ファイル名(任意:geoext16_popup.html)」に入力して「完了」ボタンをクリック。
「charset」を「utf-8」にします。
以下のように HTML を作成します。
geoext15_permalink.html をコピーし、外部 JavaScript 読み込みファイルを修正しマップのスタイルシートを追加し body タグ内に container を設定します。

---
<title>GeoExt16 Popup</title>
---
<!-- permalink.js 追加 -->
<script type="text/javascript" src="./popup.js"></script>
<!-- map スタイルシート追加 -->
<style type="text/css">
div#map {
width: 650px;
height: 400px;
position: relative;
}
</style>

</head>
<body>
<h1 id="title">GeoExt 19 - Popup</h1>
<p id="shortdesc">
Popup Example
</p>
<p>Click on the point in the map panel to open a popup.</p>

<p>ポップアップを開くためにマップパネル上でポイントをクリックしてください。</p>
<div id="container"></div>
</body>
</html>

2010年12月1日水曜日

GeoExt15 Permalink

Permalink

Example サイト
http://www.geoext.org/examples.html

「Permalink」リンクをクリックすると Permalink Example が表示されます。
permalink.js. を参考にします。

説明を意訳すると、現在のマップの位置と表示されているレイヤーと共にパーマリンクを生成する方法を示します。


var permalinkProvider;

Ext.onReady(function() {

// set a permalink provider
permalinkProvider = new GeoExt.state.PermalinkProvider({encodeType: false});
Ext.state.Manager.setProvider(permalinkProvider);

// var map = new OpenLayers.Map();
var map = new OpenLayers.Map('map', { // 東京マップ用
projection: new OpenLayers.Projection("EPSG:2456"),
maxResolution: 'auto',
maxExtent: new OpenLayers.Bounds(-279000,1054000,-185000,1104000),
units: 'meters',
displayProjection: new OpenLayers.Projection("EPSG:4326")
});


map.addLayers([
new OpenLayers.Layer.WMS( "Tokyo Height WMS", // 東京レイヤ
"http://192.168.1.6/cgi-bin/mapserv?",
{
map: '/home/nob61/mapfile/tokyo_bmi_pgis_img2.map',
layers: 'height',
format: 'image/png'
}),
new OpenLayers.Layer.WMS( "Tokyo Kukaku Sen WMS",
"http://192.168.1.6/cgi-bin/mapserv?",
{
map: '/home/nob61/mapfile/tokyo_bmi_pgis_img2.map',
layers: 'kukaku',
transparent: true,
format: 'image/png'
})
])
map.addControl(new OpenLayers.Control.LayerSwitcher());
map.addControl(new OpenLayers.Control.MousePosition());
map.addControl(new OpenLayers.Control.ScaleLine());


var mapPanel = new GeoExt.MapPanel({
title: "GeoExt MapPanel",
renderTo: "mappanel",
height: 400,
width: 600,
map: map,
// center: new OpenLayers.LonLat(5, 45),
// zoom: 4,
stateId: "map",
prettyStateKeys: true
});

// update link when state chnages
var onStatechange = function(provider) {
var l = provider.getLink();
Ext.get("permalink").update("<a href=" + l + ">" + l + "</a>");
};
permalinkProvider.on({statechange: onStatechange});
});

HTML ファイルを新規作成します。
「openlayersTokyoproj」 を右クリックして 新規 -> HTML ファイル をクリック。
「HTML ファイル」ウィンドウの「ファイル名(任意:geoext15_permalink.html)」に入力して「完了」ボタンをクリック。
「charset」を「utf-8」にします。
以下のように HTML を作成します。
geoext14_wms-tree.html をコピーし、外部 JavaScript 読み込みファイルを修正し body タグ内に mappanel と permalink を設定します。

---
<title>GeoExt15 Permalink</title>
---
<!-- permalink.js 追加 -->
<script type="text/javascript" src="./permalink.js"></script>

</head>
<body>
<div id="desc">
<h1 id="title">GeoExt 15 - Permalink</h1>
<p id="shortdesc">
Permalink Example
</p>
<p>This example shows how to generate permalinks with the current map
position and visible layers.</p>

<p>この例では、現在のマップの位置と表示されているレイヤーと共にパーマリンクを
生成する方法を示します。</p>

<div id="mappanel"></div>
<h2>Permalink:</h2>
<div id="permalink"></div>
</div>
</body>
</html>

地図をパンやズームなどの操作をすると Permalink が表示されます。