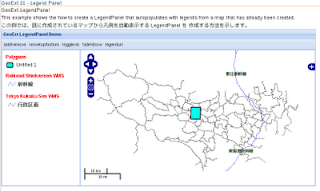
Example サイト
http://www.geoext.org/examples.html
「Legend Panel」リンクをクリックすると GeoExt.LegendPanel が表示されます。
legendpanel.js. を参考にします。
説明を意訳すると、マップから凡例を自動表示して LegendPanel を作成する方法を示します。
var mapPanel, legendPanel;

Ext.onReady(function() {
 // var map = new OpenLayers.Map({allOverlays: true});
 // 東京都用マップ設定
 var map = new OpenLayers.Map('map', {
  allOverlays: true,
  projection: new OpenLayers.Projection("EPSG:2456"),
  maxResolution: 'auto', //, '367.1875','183.594'
  maxExtent: new OpenLayers.Bounds(-279000,1054000,-185000,1104000),
  units: 'meters',
  displayProjection: new OpenLayers.Projection("EPSG:4326")
 });
 map.addLayers([
/*
  new OpenLayers.Layer.WMS(
   "Tasmania",
   "http://demo.opengeo.org/geoserver/wms?",
   {layers: 'topp:tasmania_state_boundaries', format: 'image/png', transparent: true},
   {singleTile: true}),
  new OpenLayers.Layer.WMS(
   "Cities and Roads",
   "http://demo.opengeo.org/geoserver/wms?",
   {layers: 'topp:tasmania_cities,topp:tasmania_roads', format: 'image/png', transparent: true},
   {singleTile: true}),
*/
  // 東京都レイヤ
  new OpenLayers.Layer.WMS( "Tokyo Kukaku Sen WMS",
   "http://192.168.1.6/cgi-bin/mapserv?",
   {
    map: '/home/nob61/mapfile/tokyo_bmi_pgis_img2.map',
    layers: 'kukaku',
    transparent: true,
    format: 'image/png'
  }),
  // 新幹線レイヤ
  new OpenLayers.Layer.WMS( "Railroad Shinkansen WMS",
   "http://192.168.1.6/cgi-bin/mapserv?",
   {
    map: '/home/nob61/mapfile/tokyo_pf_pgis.map',
    layers: 'shinkansen',
    transparent: true,
    format: 'image/png'
   },{
    projection: new OpenLayers.Projection("EPSG:4326")
   }
  ),
  // ベクタフィーチャレイヤ
  new OpenLayers.Layer.Vector('Polygons', {styleMap: new OpenLayers.StyleMap({
   "default": new OpenLayers.Style({
    pointRadius: 8,
    fillColor: "#00ffee",
    strokeColor: "#000000",
    strokeWidth: 2
  }) }) })
 ]);
 // プロジェクションの変更
 var proj1 = new OpenLayers.Projection("EPSG:4326");
 var proj2 = new OpenLayers.Projection("EPSG:2456");
 var polygon = OpenLayers.Geometry.fromWKT(
  "POLYGON(139.4 35.7, 139.45 35.7, 139.45 35.75, 139.4 35.75)"
 );
 polygon.transform(proj1, proj2);
 map.layers[2].addFeatures([
 // new OpenLayers.Feature.Vector(OpenLayers.Geometry.fromWKT(
 //  "POLYGON(146.1 -41, 146.2 -41, 146.2 -41.1, 146.1 -41.1)"))
   new OpenLayers.Feature.Vector(polygon) // 修正
 ]);
 map.addControl(new OpenLayers.Control.LayerSwitcher());
 map.addControl(new OpenLayers.Control.MousePosition()); // 追加
 map.addControl(new OpenLayers.Control.ScaleLine()); // 追加
 // JR レイヤの追加と削除
 var addRemoveLayer = function() {
//if(mapPanel.map.layers.indexOf(water) == -1) {
// mapPanel.map.addLayer(water);
  if(mapPanel.map.layers.indexOf(jrline) == -1) {
   mapPanel.map.addLayer(jrline);
  } else {
// mapPanel.map.removeLayer(water);
   mapPanel.map.removeLayer(jrline);
  }
 };
 // 第1レイヤ(kukaku)の移動(投影法のエラーになります)
 var moveLayer = function(idx) {
  var layer = layerRec0.getLayer();
  var idx = mapPanel.map.layers.indexOf(layer) == 0 ?
  mapPanel.map.layers.length : 0;
  mapPanel.map.setLayerIndex(layerRec0.getLayer(), idx);
 };
 // 第2レイヤ(shinkansen)の表示と非表示
 var toggleVisibility = function() {
  var layer = layerRec1.getLayer();
  layer.setVisibility(!layer.getVisibility());
 };
 // 第1レイヤの凡例の表示と非表示
 var updateHideInLegend = function() {
  layerRec0.set("hideInLegend", !layerRec0.get("hideInLegend"));
 };
 // 第1レイヤの凡例の画像変更
 var updateLegendUrl = function() {
  var url = layerRec0.get("legendURL");
  layerRec0.set("legendURL", otherUrl);
  otherUrl = url;
 };
 mapPanel = new GeoExt.MapPanel({
  region: 'center',
  height: 400,
  width: 600,
  map: map //,
//  center: new OpenLayers.LonLat(146.4, -41.6),
//  zoom: 7
 });
 // give the record of the 1st layer a legendURL, which will cause
 // UrlLegend instead of WMSLegend to be used
 var layerRec0 = mapPanel.layers.getAt(0);
// layerRec0.set("legendURL", "http://demo.opengeo.org/geoserver/wms?FORMAT=image%2Fgif&TRANSPARENT=true&SERVICE=WMS&VERSION=1.1.1&REQUEST=GetLegendGraphic&EXCEPTIONS=application%2Fvnd.ogc.se_xml&LAYER=topp%3Atasmania_state_boundaries");
 layerRec0.set("legendURL", "http://192.168.1.6/cgi-bin/mapserv?map=/home/nob61/mapfile/tokyo_bmi_pgis_img2.map&FORMAT=image%2Fpng&TRANSPARENT=true&SERVICE=WMS&VERSION=1.1.1&REQUEST=GetLegendGraphic&EXCEPTIONS=application%2Fvnd.ogc.se_xml&LAYER=kukaku");

 // store the layer that we will modify in toggleVis()
 var layerRec1 = mapPanel.layers.getAt(1);

 // stores another legendURL for the legendurl button action
 var otherUrl = "http://www.geoext.org/trac/geoext/chrome/site/img/GeoExt.png";
 // create another layer for the add/remove button action
/*
 var water = new OpenLayers.Layer.WMS("Bodies of Water",
  "http://demo.opengeo.org/geoserver/wms?",
  {layers: 'topp:tasmania_water_bodies', format: 'image/png', transparent: true},
  {singleTile: true}
 );
*/
 // JR レイヤ
 var jrline = new OpenLayers.Layer.WMS( "Railroad JR Line WMS",
  "http://192.168.1.6/cgi-bin/mapserv?",
  {
   map: '/home/nob61/mapfile/tokyo_pf_pgis.map',
   layers: 'jrline',
   transparent: true,
   format: 'image/png'
  },{
   projection: new OpenLayers.Projection("EPSG:4326"),
   singleTile: true
  }
 );
 legendPanel = new GeoExt.LegendPanel({
  defaults: {
   labelCls: 'mylabel',
   style: 'padding:5px'
  },
  bodyStyle: 'padding:5px',
//  width: 350,
  width: 200, // mapPanel の width よりもこちらが優先されるので Ext.Panel の width に合わせるため修正。
  autoScroll: true,
  region: 'west'
 });
 new Ext.Panel({
  title: "GeoExt LegendPanel Demo",
  layout: 'border',
  renderTo: 'view',
  height: 400,
  width: 800,
  tbar: new Ext.Toolbar({
   items: [
    {text: 'add/remove', handler: addRemoveLayer},
    {text: 'movetop/bottom', handler: moveLayer },
    {text: 'togglevis', handler: toggleVisibility},
    {text: 'hide/show', handler: updateHideInLegend},
    {text: 'legendurl', handler: updateLegendUrl}
   ]
  }),
  items: [legendPanel, mapPanel]
 });
});
HTML ファイルを新規作成します。
「openlayersTokyoproj」 を右クリックして 新規 -> HTML ファイル をクリック。
「HTML ファイル」ウィンドウの「ファイル名(任意:geoext21_legendpanel.html)」に入力して「完了」ボタンをクリック。
「charset」を「utf-8」にします。
以下のように HTML を作成します。
geoext20_zoomslider.html をコピーし、外部 JavaScript 読み込みファイルを修正し凡例の文字のスタイルを設定し body タグ内にターゲット id を設定します。
  <title>GeoExt21 Legend Panel</title>
---
<!-- legendpanel.js 追加 -->
  <script type="text/javascript" src="./legendpanel.js"></script>
<!-- 凡例の文字のスタイル 追加 -->
  <style type="text/css">
   .mylabel {
    font-weight: bold;
    color: red;
   }
  </style>

 </head>
 <body>
  <h1 id="title">GeoExt 21 - Legend Panel</h1>
  <p id="shortdesc">
   GeoExt.LegendPanel
  </p>
  <p>This example shows the how to create a LegendPanel that autopopulates
   with legends from a map that has already been created.</p>

  <p>この例では、既に作成されているマップから凡例を自動表示する LegendPanel を
   作成する方法を示します。</p>

  <div id="view"></div>

 </body>
</html>

MapServer の WMS で、map の投影法が EPSG:2456 のためにオプション('unit' が 'meter' など)を設定したとき、マップの表示サイズ(今回は GeoExt.MapPanel のサイズ)でズームが自動的に決定されるので、表示できない倍率になることがあります。ここの東京都の地図は height と width の比が 2:3 になっているのでマップの表示サイズもこれに合わせるようにしました。

0 件のコメント:
コメントを投稿