Example サイト
http://www.geoext.org/examples.html
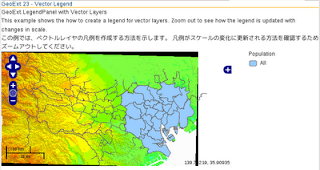
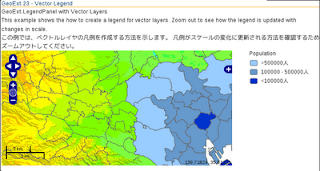
「Vector Legend」リンクをクリックすると GeoExt.LegendPanel with Vector Layers が表示されます。
vector-legend.js. を参考にします。
説明を意訳すると、ベクトルレイヤの凡例を作成する方法で、凡例がスケールの変化に更新される方法を確認します。
var mapPanel, legendPanel;

Ext.onReady(function() {

 var rules = [
  new OpenLayers.Rule({
   title: ">500000人", // "> 2000m",
   maxScaleDenominator: 520423, //(Scale Chooser より)3000000,
   filter: new OpenLayers.Filter.Comparison({
    type: OpenLayers.Filter.Comparison.GREATER_THAN,
    property: "total", // "elevation",
    value: 500000 // 2000
   }),
   symbolizer: {
    graphicName: "star",
    pointRadius: 8,
    fillColor: "#99ccff",
    strokeColor: "#666666",
    strokeWidth: 1
   }
  }),
  new OpenLayers.Rule({
   title: "100000 - 500000人", // "1500 - 2000m",
   maxScaleDenominator: 520423, // 3000000,
   filter: new OpenLayers.Filter.Comparison({
    type: OpenLayers.Filter.Comparison.BETWEEN,
    property: "total", // "elevation",
    upperBoundary: 500000, // 2000,
    lowerBoundary: 100000 // 1500
   }),
   symbolizer: {
    graphicName: "star", // 表示できません
    pointRadius: 6,
    fillColor: "#6699cc",
    strokeColor: "#666666",
    strokeWidth: 1
   }
  }),
  new OpenLayers.Rule({
   title: "<100000人", // "< 1500m",
   maxScaleDenominator: 520423, // 3000000,
   filter: new OpenLayers.Filter.Comparison({
    type: OpenLayers.Filter.Comparison.LESS_THAN,
    property: "total", // "elevation",
    value: 100000 // 1500
   }),
   symbolizer: {
    graphicName: "star",
    pointRadius: 4,
    fillColor: "#0033cc",
    strokeColor: "#666666",
    strokeWidth: 1
   }
  }),
  new OpenLayers.Rule({
   title: "All",
   minScaleDenominator: 520423, // 3000000,
   symbolizer: {
    graphicName: "star",
    pointRadius: 5,
    fillColor: "#99ccff",
    strokeColor: "#666666",
    strokeWidth: 1
   }
  })
 ];
/*
 var imagery = new OpenLayers.Layer.WMS(
  "Imagery",
  "http://maps.opengeo.org/geowebcache/service/wms",
  {layers: "bluemarble"},
  {displayInLayerSwitcher: false}
 );
*/
 // 東京都用マップ設定
 var map = new OpenLayers.Map('map', {
  controls: [
   new OpenLayers.Control.PanZoom(),
   new OpenLayers.Control.LayerSwitcher(),
   new OpenLayers.Control.MousePosition(),
   new OpenLayers.Control.ScaleLine()
  ],
  allOverlays: true,
  projection: new OpenLayers.Projection("EPSG:2456"),
  maxResolution: 'auto',
  maxExtent: new OpenLayers.Bounds(-279000,1054000,-185000,1104000),
  units: 'meters',
  displayProjection: new OpenLayers.Projection("EPSG:4326")
 });
   // 東京都レイヤ
   var layer1 = new OpenLayers.Layer.WMS( "Tokyo Height WMS",
    "http://192.168.1.6/cgi-bin/mapserv?",
    {
     map: '/home/user/mapfile/tokyo_bmi_pgis_img2.map',
     layers: 'height',
     format: 'image/png'
    }, {
     displayInLayerSwitcher: false
   });
   var layer2 = new OpenLayers.Layer.WMS( "Tokyo Kukaku Sen WMS",
    "http://192.168.1.6/cgi-bin/mapserv?",
    {
     map: '/home/user/mapfile/tokyo_bmi_pgis_img2.map',
     layers: 'kukaku',
     transparent: true,
     format: 'image/png'
    }, {
     displayInLayerSwitcher: false
   });
// var summits = new OpenLayers.Layer.Vector("Summits", {
 var population = new OpenLayers.Layer.Vector("Population", {
  strategies: [new OpenLayers.Strategy.Fixed()],
  protocol: new OpenLayers.Protocol.HTTP({
   url: "mapserver_gyoseikai.json", // "data/summits.json",
   format: new OpenLayers.Format.GeoJSON({
    'internalProjection': new OpenLayers.Projection("EPSG:2456"),
    'externalProjection': new OpenLayers.Projection("EPSG:4326")
   })
  }),
  styleMap: new OpenLayers.StyleMap(new OpenLayers.Style({}, {rules: rules}))
 });
 mapPanel = new GeoExt.MapPanel({
  renderTo: "mappanel",
  border: false,
  layers: [layer1,layer2, population],
//  center: [6.3, 45.6],
  height: 256, // IE6 wants this
//  zoom: 8
  map: map
 });
 legendPanel = new GeoExt.LegendPanel({
  layerStore: mapPanel.layers,
  renderTo: "legend",
  border: false
 });

});
HTML ファイルを新規作成します。
「openlayersTokyoproj」 を右クリックして 新規 -> HTML ファイル をクリック。
「HTML ファイル」ウィンドウの「ファイル名(任意:geoext23_vector-legend.html)」に入力して「完了」ボタンをクリック。
「charset」を「utf-8」にします。
以下のように HTML を作成します。
geoext22_tree-legend.html をコピーし、外部 JavaScript 読み込みファイルを修正し凡例の文字のスタイルを設定し body タグ内にターゲット id を設定します。
---
  <title>GeoExt23 Vector Legend</title>
---
<!-- vector-legend.js 追加 -->
  <script type="text/javascript" src="./vector-legend.js"></script>
<!-- MapPanel LegendPanel のスタイル 追加 -->
  <style>
   #wrapper {
    position: relative;
   }
   #mappanel {
    position: absolute;
    top: 0px;
    left: 0px;
    width: 512px;
    height: 256px;
   }
    #legend {
     position: absolute;
     top: 0px;
     left: 550px;
     height: 256px;
     width: 150px;
   }
  </style>

 </head>
 <body>

  <h1 id="title">GeoExt 23 - Vector Legend</h1>
  <p id="shortdesc">
   GeoExt.LegendPanel with Vector Layers
  </p>
  <p>This example shows the how to create a legend for vector layers.
   Zoom out to see how the legend is updated with changes in scale.</p>

  <p>この例では、ベクトルレイヤの凡例を作成する方法を示します。
   凡例がスケールの変化に更新される方法を確認するためズームアウトしてください。</p>

  <div id="wrapper">
   <div id="mappanel"></div>
   <div id="legend"></div>
  </div>

 </body>
</html>


データがポリゴンなので面が塗りつぶされます。

0 件のコメント:
コメントを投稿