
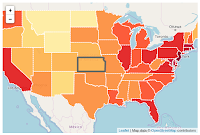
Interactive Choropleth Map
This is a case study of creating a colorful interactive choropleth map(Choropleth map[https://en.wikipedia.org/wiki/Choropleth_map])of US States Population Density with the help of GeoJSON and some custom controls (that will hopefully convince all the remaining major news and government websites that do not use Leaflet yet to start doing so).
これは、GeoJSON と(始めるために Leaflet をまだ使用していないという残存する主要なニュースと政府のウェッブサイトすべてを納得させることが期待される)いくつかのカスタムコントロール(Control [Leaflet API])の支援を使用して、US States Population Density(アメリカ合衆国州別人口密度)の色とりどりのインタラクティブな choropleth map を作成する事例研究です。
The tutorial was inspired by the Texas Tribune US Senate Runoff Results map (also powered by Leaflet), created by Ryan Murphy.
チュートリアルは、Ryan Murphy によって作成された(Leaflet によっても動作している)Texas Tribune US Senate Runoff Results map から発想を得られています。
Data Source
We’ll be creating a visualization of population density per US state. As the amount of data (state shapes and the density value for each state) is not very big, the most convenient and simple way to store and then display it is GeoJSON.
アメリカの州ごとの人口密度の視覚化をします。データ量(州の形状と州ごとの{人口}密度の値)は大きくないので、それを格納し、それから表示する最も便利で単純な方法は GeoJSON です。
Each feature of our GeoJSON data (us-states.js) will look like this:
GeoJSON データ(us-states.js)の各フィーチャは、このようになっています:
(訳注:「us-states.js」をダウンロードして使用します。)
The GeoJSON with state shapes was kindly shared by Mike Bostock of D3 fame, extended with density values from this Wikipedia article based on July 1st 2011 data from US Census Bureau and assigned to statesData JS variable.
州の形状をを伴った GeoJSON は、D3 で有名な Mike Bostock によって好意的に共有され、米国製調査局の2011年7月1日データを元としたこのウィキペディアの記事からの人口密度を拡張し、statesData JS 変数を割り当てます。
Basic States Map
Let’s display our states data on a map with a custom Mapbox style for nice grayscale tiles that look perfect as a background for visualizations:
マップに可視化のための背景として最適なグレイスケールタイルのカスタム Mapbox スタイルで州のデータを表示します。
(訳注:実際には、Mapbox の代わりに OpenStreetMap を使用します。)

Adding Some Color
Now we need to color the states according to their population density. Choosing nice colors for a map can be tricky, but there’s a great tool that can help with it — ColorBrewer. Using the values we got from it, we create a function that returns a color based on population density:
最初に、人口密度に従って州を色分けする必要があります。マップに適した色を選ぶことは、巧妙にできますが、それを支援するすぐれたツール - ColorBrewer - があります。そこから取得する値を使用するために、人口密度をもととした色を返すファンクションを作成します:
Next we define a styling function for our GeoJSON layer so that its fillColor depends on feature.properties.density property, also adjusting the appearance a bit and adding a nice touch with dashed stroke.
次に、fillColor は、feature.properties.density プロパティに依存し、同じように、外観を少し調整したりダッシュストロークで最適なタッチを追加するように、GeoJSON レイヤのスタイルファンクションを定義します。
Looks much better now!
これで見た目が良くなりました。

Adding Interaction
Now let’s make the states highlighted visually in some way when they are hovered with a mouse. First we’ll define an event listener for layer mouseover event:
では、マウスでホバー(ポインタをかざ)されるとき、いくつかの方法で州を視覚的に強調します。最初に、layer mouseover イベントに対するイベントリスナを定義します:
Here we get access to the layer that was hovered through e.target, set a thick grey border on the layer as our highlight effect, also bringing it to the front so that the border doesn’t clash with nearby states (but not for IE, Opera or Edge, since they have problems doing bringToFront on mouseover).
ここで、e.target を通してホバーされたレイヤにアクセスし、強調効果としてレイヤの薄いグレーの境界を設定し、境界が近くの州と衝突しないために前面にも持っていきます。(しかし、IE や Opera、Edge 用ではありません。それは、mouseover 上で bringToFront を実行する問題があるためです。)
Next we’ll define what happens on mouseout:
次に、mouseout で発生することを定義します。
The handy geojson.resetStyle method will reset the layer style to its default state (defined by our style function). For this to work, make sure our GeoJSON layer is accessible through the geojson variable by defining it before our listeners and assigning the layer to it later:
手軽な geojson.resetStyle メソッドは、レイヤスタイルを(style ファンクションによって定義される)初期状態に再設定します。これが動作するために、リスナの前にそれを定義することによって geojson 変数を通して、GeoJSON がアクセス可能になることを確かめ、後でレイヤをそれに割り当てます:
As an additional touch, let’s define a click listener that zooms to the state:
追加タッチのために、州に焦点を当てる click リスナを定義しましょう:
Now we’ll use the onEachFeature option to add the listeners on our state layers:
ここで、州レイヤにリスナを追加するために onEachFeature オプションを使用します:
This makes the states highlight nicely on hover and gives us the ability to add other interactions inside our listeners.
これでホバーして州をうまくハイライト(強調)させ、リスナ内の他のインタラクションを追加する性能を与えます。
Custom Info Control
We could use the usual popups on click to show information about different states, but we’ll choose a different route — showing it on state hover inside a custom control.
異なった州について情報を表示するためにクリックで通常のポップアップを使用しますが、違ったルート - カスタムコントロール内で州がホバー状態でそれを表示することを選びます。
Here’s the code for our control:
これはコントロールのコードです:
We need to update the control when the user hovers over a state, so we’ll also modify our listeners as follows:
ユーザが州の上をホバーしたときコントロールが更新される必要があり、それで、次のようにリスナも変更します:
The control also needs some CSS styles to look nice:
コントロールは、よく見えるためにいくつかの CSS スタイルも必要です:

Custom Legend Control
Creating a control with a legend is easier, since it is static and doesn’t change on state hover. JavaScript code:
凡例とともにコントロールを作成することはもっと簡単で、そのため、それは静的で、州がホバーした状態で変更しません:
CSS styles for the control (we also reuse the info class defined earlier):
コントロールのための CSS スタイル(前に定義された info クラスも再利用します)
Enjoy the result on the top of this page, or on a separate page.
このページの上部の結果、または、別ページを見てください。

This is a case study of creating a colorful interactive choropleth map(Choropleth map[https://en.wikipedia.org/wiki/Choropleth_map])of US States Population Density with the help of GeoJSON and some custom controls (that will hopefully convince all the remaining major news and government websites that do not use Leaflet yet to start doing so).
これは、GeoJSON と(始めるために Leaflet をまだ使用していないという残存する主要なニュースと政府のウェッブサイトすべてを納得させることが期待される)いくつかのカスタムコントロール(Control [Leaflet API])の支援を使用して、US States Population Density(アメリカ合衆国州別人口密度)の色とりどりのインタラクティブな choropleth map を作成する事例研究です。
The tutorial was inspired by the Texas Tribune US Senate Runoff Results map (also powered by Leaflet), created by Ryan Murphy.
チュートリアルは、Ryan Murphy によって作成された(Leaflet によっても動作している)Texas Tribune US Senate Runoff Results map から発想を得られています。
Data Source
We’ll be creating a visualization of population density per US state. As the amount of data (state shapes and the density value for each state) is not very big, the most convenient and simple way to store and then display it is GeoJSON.
アメリカの州ごとの人口密度の視覚化をします。データ量(州の形状と州ごとの{人口}密度の値)は大きくないので、それを格納し、それから表示する最も便利で単純な方法は GeoJSON です。
Each feature of our GeoJSON data (us-states.js) will look like this:
GeoJSON データ(us-states.js)の各フィーチャは、このようになっています:
(訳注:「us-states.js」をダウンロードして使用します。)
{
 "type": "Feature",
 "properties": {
  "name": "Alabama",
  "density": 94.65
 },
 "geometry": ...
  ...
}
The GeoJSON with state shapes was kindly shared by Mike Bostock of D3 fame, extended with density values from this Wikipedia article based on July 1st 2011 data from US Census Bureau and assigned to statesData JS variable.
州の形状をを伴った GeoJSON は、D3 で有名な Mike Bostock によって好意的に共有され、米国製調査局の2011年7月1日データを元としたこのウィキペディアの記事からの人口密度を拡張し、statesData JS 変数を割り当てます。
Basic States Map
Let’s display our states data on a map with a custom Mapbox style for nice grayscale tiles that look perfect as a background for visualizations:
マップに可視化のための背景として最適なグレイスケールタイルのカスタム Mapbox スタイルで州のデータを表示します。
var mapboxAccessToken = {your access token here};
var map = L.map('map').setView([37.8, -96], 4);
L.tileLayer('https://api.tiles.mapbox.com/v4/{id}/{z}/{x}/{y}.png?access_token=' + mapboxAccessToken, {
    id: 'mapbox.light',
    attribution: ...
}).addTo(map);

L.geoJson(statesData).addTo(map);
(訳注:実際には、Mapbox の代わりに OpenStreetMap を使用します。)

Adding Some Color
Now we need to color the states according to their population density. Choosing nice colors for a map can be tricky, but there’s a great tool that can help with it — ColorBrewer. Using the values we got from it, we create a function that returns a color based on population density:
最初に、人口密度に従って州を色分けする必要があります。マップに適した色を選ぶことは、巧妙にできますが、それを支援するすぐれたツール - ColorBrewer - があります。そこから取得する値を使用するために、人口密度をもととした色を返すファンクションを作成します:
function getColor(d) {
 return d > 1000 ? '#800026' :
        d > 500  ? '#BD0026' :
        d > 200  ? '#E31A1C' :
        d > 100  ? '#FC4E2A' :
        d > 50   ? '#FD8D3C' :
        d > 20   ? '#FEB24C' :
        d > 10   ? '#FED976' :
                      '#FFEDA0';
}
Next we define a styling function for our GeoJSON layer so that its fillColor depends on feature.properties.density property, also adjusting the appearance a bit and adding a nice touch with dashed stroke.
次に、fillColor は、feature.properties.density プロパティに依存し、同じように、外観を少し調整したりダッシュストロークで最適なタッチを追加するように、GeoJSON レイヤのスタイルファンクションを定義します。
function style(feature) {
 return {
  fillColor: getColor(feature.properties.density),
  weight: 2,
  opacity: 1,
  color: 'white',
  dashArray: '3',
  fillOpacity: 0.7
 };
}
L.geoJson(statesData, {style: style}).addTo(map);
Looks much better now!
これで見た目が良くなりました。

Adding Interaction
Now let’s make the states highlighted visually in some way when they are hovered with a mouse. First we’ll define an event listener for layer mouseover event:
では、マウスでホバー(ポインタをかざ)されるとき、いくつかの方法で州を視覚的に強調します。最初に、layer mouseover イベントに対するイベントリスナを定義します:
function highlightFeature(e) {
 var layer = e.target;

 layer.setStyle({
  weight: 5,
  color: '#666',
  dashArray: '',
  fillOpacity: 0.7
 });
 if (!L.Browser.ie && !L.Browser.opera && !L.Browser.edge) {
  layer.bringToFront();
 }
}
Here we get access to the layer that was hovered through e.target, set a thick grey border on the layer as our highlight effect, also bringing it to the front so that the border doesn’t clash with nearby states (but not for IE, Opera or Edge, since they have problems doing bringToFront on mouseover).
ここで、e.target を通してホバーされたレイヤにアクセスし、強調効果としてレイヤの薄いグレーの境界を設定し、境界が近くの州と衝突しないために前面にも持っていきます。(しかし、IE や Opera、Edge 用ではありません。それは、mouseover 上で bringToFront を実行する問題があるためです。)
Next we’ll define what happens on mouseout:
次に、mouseout で発生することを定義します。
function resetHighlight(e) {
 geojson.resetStyle(e.target);
}
The handy geojson.resetStyle method will reset the layer style to its default state (defined by our style function). For this to work, make sure our GeoJSON layer is accessible through the geojson variable by defining it before our listeners and assigning the layer to it later:
手軽な geojson.resetStyle メソッドは、レイヤスタイルを(style ファンクションによって定義される)初期状態に再設定します。これが動作するために、リスナの前にそれを定義することによって geojson 変数を通して、GeoJSON がアクセス可能になることを確かめ、後でレイヤをそれに割り当てます:
var geojson;
// ... our listeners
geojson = L.geoJson(...);
As an additional touch, let’s define a click listener that zooms to the state:
追加タッチのために、州に焦点を当てる click リスナを定義しましょう:
function zoomToFeature(e) {
 map.fitBounds(e.target.getBounds());
}
Now we’ll use the onEachFeature option to add the listeners on our state layers:
ここで、州レイヤにリスナを追加するために onEachFeature オプションを使用します:
function onEachFeature(feature, layer) {
 layer.on({
  mouseover: highlightFeature,
  mouseout: resetHighlight,
  click: zoomToFeature
 });
}
geojson = L.geoJson(statesData, {
 style: style,
 onEachFeature: onEachFeature
}).addTo(map);
This makes the states highlight nicely on hover and gives us the ability to add other interactions inside our listeners.
これでホバーして州をうまくハイライト(強調)させ、リスナ内の他のインタラクションを追加する性能を与えます。

Custom Info Control
We could use the usual popups on click to show information about different states, but we’ll choose a different route — showing it on state hover inside a custom control.
異なった州について情報を表示するためにクリックで通常のポップアップを使用しますが、違ったルート - カスタムコントロール内で州がホバー状態でそれを表示することを選びます。
Here’s the code for our control:
これはコントロールのコードです:
var info = L.control();

info.onAdd = function (map) {
 this._div = L.DomUtil.create('div', 'info'); // create a div with a class "info"
 this.update();
 return this._div;
};
// method that we will use to update the control based on feature properties passed
info.update = function (props) {
 this._div.innerHTML = '<h4>US Population Density</h4>' +  (props ?
  '<b>' + props.name + '</b><br />' + props.density + ' people / mi<sup>2</sup>'
  : 'Hover over a state');
};
info.addTo(map);
We need to update the control when the user hovers over a state, so we’ll also modify our listeners as follows:
ユーザが州の上をホバーしたときコントロールが更新される必要があり、それで、次のようにリスナも変更します:
function highlightFeature(e) {
 ...
 info.update(layer.feature.properties);
}
function resetHighlight(e) {
 ...
 info.update();
}
The control also needs some CSS styles to look nice:
コントロールは、よく見えるためにいくつかの CSS スタイルも必要です:
.info {
 padding: 6px 8px;
 font: 14px/16px Arial, Helvetica, sans-serif;
 background: white;
 background: rgba(255,255,255,0.8);
 box-shadow: 0 0 15px rgba(0,0,0,0.2);
 border-radius: 5px;
}
.info h4 {
 margin: 0 0 5px;
 color: #777;
}

Custom Legend Control
Creating a control with a legend is easier, since it is static and doesn’t change on state hover. JavaScript code:
凡例とともにコントロールを作成することはもっと簡単で、そのため、それは静的で、州がホバーした状態で変更しません:
var legend = L.control({position: 'bottomright'});
legend.onAdd = function (map) {
 var div = L.DomUtil.create('div', 'info legend'),
     grades = [0, 10, 20, 50, 100, 200, 500, 1000],
     labels = [];
// loop through our density intervals and generate a label with a colored square for each interval
 for (var i = 0; i < grades.length; i++) {
  div.innerHTML +=
   '<i style="background:' + getColor(grades[i] + 1) + '"></i> ' +
   grades[i] + (grades[i + 1] ? '–' + grades[i + 1] + '<br>' : '+');
 }
 return div;
};

legend.addTo(map);
CSS styles for the control (we also reuse the info class defined earlier):
コントロールのための CSS スタイル(前に定義された info クラスも再利用します)
.legend {
 line-height: 18px;
 color: #555;
}
.legend i {
 width: 18px;
 height: 18px;
 float: left;
 margin-right: 8px;
 opacity: 0.7;
}
Enjoy the result on the top of this page, or on a separate page.
このページの上部の結果、または、別ページを見てください。

全コード
<!DOCTYPE html>
<html>
 <head>
  <meta charset="UTF-8">
  <link rel="stylesheet" href="./leaflet13/leaflet.css" />
  <style>
  /* Custom Info Control */
   .info {
    padding: 6px 8px;
    font: 14px/16px Arial, Helvetica, sans-serif;
    background: white;
    background: rgba(255,255,255,0.8);
    box-shadow: 0 0 15px rgba(0,0,0,0.2);
    border-radius: 5px;
   }
   .info h4 {
    margin: 0 0 5px;
    color: #777;
   }
   /* Custom Legend Control */
   .legend {
    line-height: 18px;
    color: #555;
   }
   .legend i {
    width: 18px;
    height: 18px;
    float: left;
    margin-right: 8px;
    opacity: 0.7;
   }
  </style>
  <script src="./leaflet13/leaflet.js"></script>
  <title>Interactive Choropleth Map</title>
 </head>
 <body>
  <div id="map" style="width: 600px; height: 400px;"></div>
  <script type="text/javascript" src="us-states.js"></script>
<script>
//Basic States Map
var map = L.map('map').setView([37.8, -96], 4);
L.tileLayer('https://{s}.tile.openstreetmap.org/{z}/{x}/{y}.png', {
attribution: 'Map data © <a href="https://www.openstreetmap.org/copyright">OpenStreetMap</a> contributors'
}).addTo(map);
// var geojson = L.geoJSON(statesData).addTo(map);
   //Adding Some Color
   function getColor(d) {
    return d > 1000 ? '#800026' :
           d > 500  ? '#BD0026' :
           d > 200  ? '#E31A1C' :
           d > 100  ? '#FC4E2A' :
           d > 50   ? '#FD8D3C' :
           d > 20   ? '#FEB24C' :
           d > 10   ? '#FED976' :
                      '#FFEDA0';
   }
   function style(feature) {
    return {
     fillColor: getColor(feature.properties.density),
     weight: 2,
     opacity: 1,
     color: 'white',
     dashArray: '3',
     fillOpacity: 0.7
    };
   }
L.geoJson(statesData, {style: style}).addTo(map);
   //Adding Interaction
   function highlightFeature(e) {
    var layer = e.target;

    layer.setStyle({
     weight: 5,
     color: '#666',
     dashArray: '',
     fillOpacity: 0.7
    });
    if (!L.Browser.ie && !L.Browser.opera && !L.Browser.edge) {
     layer.bringToFront();
    }
    info.update(layer.feature.properties); //Custom Info Control
   }
   function resetHighlight(e) {
    geojson.resetStyle(e.target);
    info.update(); //Custom Info Control
   }
   function zoomToFeature(e) {
    map.fitBounds(e.target.getBounds());
   }
   function onEachFeature(feature, layer) {
    layer.on({
     mouseover: highlightFeature,
     mouseout: resetHighlight,
     click: zoomToFeature
    });
   }
   geojson = L.geoJson(statesData, {
    style: style,
    onEachFeature: onEachFeature
   }).addTo(map);
   //Custom Info Control
   var info = L.control();
   info.onAdd = function (map) {
    this._div = L.DomUtil.create('div', 'info'); // create a div with a class "info"
    this.update();
    return this._div;
   };
// method that we will use to update the control based on feature properties passed
   info.update = function (props) {
    this._div.innerHTML = '<h4>US Population Density</h4>' +  (props ?
     '<b>' + props.name + '</b><br />' + props.density + ' people / mi<sup>2</sup>'
     : 'Hover over a state');
   };
info.addTo(map);
   //Custom Legend Control
   var legend = L.control({position: 'bottomright'});
   legend.onAdd = function (map) {

    var div = L.DomUtil.create('div', 'info legend'),
     grades = [0, 10, 20, 50, 100, 200, 500, 1000],
     labels = [];
// loop through our density intervals and generate a label with a colored square for each interval
for (var i = 0; i < grades.length; i++) {
div.innerHTML +=
'<i style="background:' + getColor(grades[i] + 1) + '"></i> ' +
grades[i] + (grades[i + 1] ? '–' + grades[i + 1] + '<br>' : '+');
}
    return div;
   };

   legend.addTo(map);
  </script>
 </body>
</html>
0 件のコメント:
コメントを投稿