ラベル tile の投稿を表示しています。 すべての投稿を表示

2015年12月31日木曜日

2 - ol3.12ex 142b - WMTS Tile Transitions 2

「wmts-dimensions.js(2142-ol3ex.js)」は、マップを表示するための JavaScript ファイルです。

「2142-ol3ex.js」
// create the WMTS tile grid in the google projection
// google 投影法で WMTS タイルグリッドを作成します
var projection = ol.proj.get('EPSG:3857');
/** ol.proj.get(projectionLike)
 * Fetches a Projection object for the code specified.
 * 指定されたコードのプロジェクション・オブジェクトを取得。
 * (ol3 API)
 * projectionLike
 * Either a code string which is a combination of authority 
 * and identifier such as "EPSG:4326", or an existing p
 * rojection object, or undefined.
 * 「EPSG:4326」のように権限と識別子の組み合わせのコード文字列、
 * または、既存の投影オブジェクト、または、未定義のいずれか。
 */
var tileSizePixels = 256;
var tileSizeMtrs = ol.extent.getWidth(projection.getExtent()) / tileSizePixels;
/** ol.extent.getWidth(extent)
 * Return: Width.(ol3 API)
 */
/** getExtent()
 * Get the validity extent for this projection.
 * この投影の有効範囲を取得。(ol3 API)
 */
var matrixIds = [];
var resolutions = [];
for (var i = 0; i <= 14; i++) {
 matrixIds[i] = i;
 resolutions[i] = tileSizeMtrs / Math.pow(2, i);
 /** Math.pow(base, exponent)
  * base を exponent 乗した値、つまり、base^exponent の
  * 値を返します。
  * (MDN[https://developer.mozilla.org/ja/docs/Web/
  * JavaScript/Reference/Global_Objects/Math/pow])
  */
}
var tileGrid = new ol.tilegrid.WMTS({
/** ol.tilegrid.WMTS
 * Set the grid pattern for sources accessing WMTS 
 * tiled-image servers.
 * WMTSタイル画像サーバにアクセスするソースのグリッドパターン
 * を設定(ol3 API)
 */
 origin: ol.extent.getTopLeft(projection.getExtent()),
 /** origin:
  * The tile grid origin, i.e. where the x and y axes meet 
  * ([z, 0, 0]). Tile coordinates increase left to right 
  * and upwards. If not specified, extent or origins must 
  * be provided.
  * タイルグリッドの原点(origin)、すなわちx軸とy軸が交わる
  * 場所([Z、0、0])。タイル座標は左から右へと上方へ増加しま
  * す。指定しない場合、範囲または origins が提供されなければ
  * なりません。
  * (ol3 API[説明は Stable Only のチェックを外すと表示])
  */
 /** ol.extent.getTopLeft
  * Return: Bottom left coordinate.
  */
 resolutions: resolutions,
 /** resolutions:
  * Resolutions. The array index of each resolution needs 
  * to match the zoom level. This means that even if a 
  * minZoom is configured, the resolutions array will have 
  * a length of maxZoom + 1.
  * 解像度。各解像度の配列インデックスは、ズームレベルに一致す
  * る必要があります。これは minZoom が設定されている場合でも、
  * 解像度アレイは、maxZoom+1 の長さを有することを意味します。
  * (ol3 API[説明は Stable Only のチェックを外すと表示])
  */
 matrixIds: matrixIds
 /** matrixIds
  * matrix IDs. The length of this array needs to match 
  * the length of the resolutions array.
  * 行列のID。この配列の長さは、解像度配列の数と一致する必要
  * があります。
  * (ol3 API[説明は Stable Only のチェックを外すと表示])
  */
});
var scalgoToken = 'CC5BF28A7D96B320C7DFBFD1236B5BEB';
var wmtsSource = new ol.source.WMTS({
/** ol.source.WMTS
 * Layer source for tile data from WMTS servers.
 * WMTSサーバからタイルデータのレイヤソース。(ol3 API)
 */
 url: 'http://ts2.scalgo.com/global/wmts?token=' + scalgoToken,
 /** url:
  * A URL for the service. For the RESTful request 
  * encoding, this is a URL template. For KVP encoding, 
  * it is normal URL. A {?-?} template pattern, for 
  * example subdomain{a-f}.domain.com, may be used i
  * nstead of defining each one separately in the urls 
  * option.
  * サービスのURL。 RESTful リクエストエンコーディングに対
  * して、これはURLテンプレートです。 KVPエンコーディングに
  * 対して、通常のURLです。 {?- ?}テンプレートパターン、たと
  * えば subdomain{a-f}.domain.com は、urls オプション
  * でそれぞれを個別に定義する替りに使用することができます。
  * (ol3 API)
  */
 layer: 'hydrosheds:sea-levels',
 /** layer:
  * Layer name as advertised in the WMTS capabilities. 
  * Required.
  * WMTS capabilities でアドバタイズとしてのレイヤ名。必須。
  * (ol3 API)
  */
 format: 'image/png',
 /**format:
  * Image format. Default is image/jpeg.(ol3 API)
  */
 matrixSet: 'EPSG:3857',
 /** Matrix 
  * Matrix set. Required.(ol3 API)
  */
 attributions: [
  new ol.Attribution({
  /** ol.Attribution
   * An attribution for a layer source.
   * レイヤソースの属性(ol3 API)
   */
   html: '<a href="http://scalgo.com">SCALGO</a>'
  }),
  new ol.Attribution({
   html: '<a href="http://www.cgiar-csi.org/data/' +
    'srtm-90m-digital-elevation-database-v4-1">CGIAR-CSI SRTM</a>'
  })
 ],
 tileGrid: tileGrid,
 style: 'default',
 /** style:
  * Style name as advertised in the WMTS capabilities. 
  * Required.
  * WMTS  capabilities で advertised(?)としての style 
  * 名。(ol3 API)
  */
 dimensions: {
 /** dimensions:
  * Additional "dimensions" for tile requests. This is an 
  * object with properties named like the advertised WMTS 
  * dimensions.
  * タイル要求に対する追加の「dimensions」。これは、advertised 
  * WMTS dimensions のような名前のプロパティを持つオブジェクト
  * です。(ol3 API)
  */
  'threshold': 100
 }
});
var map = new ol.Map({
 target: 'map',
 view: new ol.View({
  projection: projection,
  center: [-9871995, 3566245],
  zoom: 6
 }),
 layers: [
  new ol.layer.Tile({
  /** ol.layer.Tile 
   * For layer sources that provide pre-rendered, tiled 
   * images in grids that are organized by zoom levels for 
   * specific resolutions. 
   * プリレンダリング(事前描画)を提供するレイヤソースのため
   * の、特定の解像度でのズームレベルによって編成されているグ
   * リッドのタイルイメージ。(ol3 API)
   */
   source: new ol.source.OSM()
   /** ol.source.OSM 
    * Layer source for the OpenStreetMap tile server.
    * OpenStreetMap タイルサーバのレイヤソース。(ol3 API)
    */
  }),
  new ol.layer.Tile({
   opacity: 0.5,
   source: wmtsSource
  })
 ]
});
var updateSourceDimension = function(source, sliderVal) {
 source.updateDimensions({'threshold': sliderVal});
 /** updateDimensions(dimensions)
  * Update the dimensions.
  * dimensions を更新します。
  * (ol3 API[説明は Stable Only のチェックを外すと表示])
  */
 document.getElementById('theinfo').innerHTML = sliderVal + ' meters';
};
updateSourceDimension(wmtsSource, 10);
document.getElementById('slider').addEventListener('input',
 function() {
/** EventTarget.addEventListener
 * addEventListener は、 1 つのイベントターゲットにイベント 
 * リスナーを1つ登録します。イベントターゲットは、ドキュメント
 * 上の単一のノード、ドキュメント自身、ウィンドウ、あるいは、
 * XMLHttpRequest です。
 *(MDN[https://developer.mozilla.org/ja/docs/Web/API/
 * EventTarget.addEventListener])
 */
 updateSourceDimension(wmtsSource, this.value);
});

2 - ol3.12ex 142a - WMTS Tile Transitions 1

「WMTS Tile Transitions (wmts-dimensions.html)」を参考に地図を表示してみます。
説明に次のようにあります。

Demonstrates smooth reloading of layers when changing a dimension continously. The demonstration layer is a global sea-level computation (flooding computation from SCALGO, underlying data from CGIAR-CSI SRTM) where cells that are flooded if the sea-level rises to more than x m are colored blue. The user selects the sea-level dimension using a slider.

継続的に寸法を変更する際にレイヤの円滑な再読み込みを示します。デモレイヤは、海面がxメータ以上に上昇すると氾濫するセルが青色に着色されるグローバル海面計算(CGIAR-CSI SRTM からのデータを基礎とする、SCALGOからの氾濫計算)です。ユーザは、スライダを使用して、海面の位置を選択します。


SRTM は、SRTM 90m Digital Elevation Database v4.1(http://www.cgiar-csi.org/data/srtm-90m-digital-elevation-database-v4-1)に次のようにあります。

The NASA Shuttle Radar Topographic Mission (SRTM) has provided digital elevation data (DEMs) for over 80% of the globe. This data is currently distributed free of charge by USGS and is available for download from the National Map Seamless Data Distribution System, or the USGS ftp site.

NASAのシャトルレーダ地形ミッション(SRTM)は、世界の80%以上のデジタル標高データ(DEM)を提供しています。このデータは、現在、USGSによって無償で配布され、ナショナルマップシームレスデータ提供システム、または USGS FTP サイトからダウンロードすることができます。


SCALGO(http://scalgo.com/) は、(http://scalgo.com/solutions/)に次のようにあります。

The power of SCALGOs unique technology for processing big large-area high-resolution terrain data sets is available through three different product lines. SCALGO Desktop is a set of software packages that allow for efficient processing of big terrain data sets on a standard workstation. Through the SCALGO Analysis product line you get access to advanced state-of-the-art hydrology and modeling products. Finally SCALGO Live is a comprehensive online solution based on the simple philosophy that it is not the terrain data itself—but what you can learn from it—that matters. SCALGO Live is the ultimate tool to extract, maintain, visualize and distribute knowledge based on your terrain data.

大きな大面積高解像度の地形データセットを処理するための SCALGO のークな技術の力は、3つの異なる製品ラインで入手することができます。 SCALGO Desktop は、標準的なワークステーション上で大きな地形データセットの効率的な処理を可能にするソフトウェア・パッケージのセットです。 SCALGO Analysis 製品ラインを通して、高度な最先端の水文学とモデリング製品へのアクセスを取得します。最後に、 SCALGO Live は、それは自体地形データではありません、しかし、それから学ぶことができる、もの、というシンプルな理念に基づいた総合的なオンラインソリューションです。 SCALGO Live は、地形データに基づいた知識を抽出、維持、視覚化、そして配布するための究極のツールです。


HTML ファイルの作成
a Eclipse のメニューの「ファイル」->「ファイルを開く」をクリックします。


b 「ファイルを開く」ウィンドウで、「user」->「mapsite」->「ol3proj」->「v3.12.1」->「examples」->「wmts-dimensions.html」をクリックして選択し、「OK」ボタンをクリックします。
同じように「wmts-dimensions.js」を開きます。


c メニューの「ファイル」->「新規」 -> 「ファイル」をクリックします。


d 「ファイル」ウィンドウで「ol3proj」をクリックして選択し、「ファイル名」を「2142-ol3ex.html」と入力し、「次へ」ボタンをクリックします。


e 「File Template」ウィンドウで「HTML 5 Template」をクリックして選択し、「OK」ボタンをクリックします。


f 「wmts-dimensions.html」の内容をコピーして「2142-ol3ex.html」に貼り付け、修正します。
g 同じように、新規に「2142-ol3ex.js」ファイルを作成し、「File Template」ウィンドウで「JavaScript Template」をクリックして選択し、「完了」ボタンをクリックして、「wmts-dimensions.js」の内容をコピーして貼り付け、修正します。「wmts-dimensions-require.js」も「2142-ol3ex-require.js」に貼り付けます。

「2142-ol3ex.html」
<!doctype html>
<html lang="en">
 <head>
  <meta charset="utf-8">
  <meta http-equiv="X-UA-Compatible" content="chrome=1">
  <meta name="viewport" content="initial-scale=1.0, user-scalable=no, width=device-width">
  <link rel="stylesheet" href="http://maxcdn.bootstrapcdn.com/font-awesome/4.4.0/css/font-awesome.min.css" type="text/css">
  <link rel="stylesheet" href="http://maxcdn.bootstrapcdn.com/bootstrap/3.3.5/css/bootstrap-combined.min.css" type="text/css">
  <!--
  <link rel="stylesheet" href="../css/ol.css" type="text/css">
  <link rel="stylesheet" href="./resources/layout.css" type="text/css">

  <link rel="stylesheet" href="./resources/prism/prism.css" type="text/css">
  <script src="./resources/zeroclipboard/ZeroClipboard.min.js"></script>

  「resources」の位置が変わりました。
  -->
  <!-- ディレクトリ修正 -->
  <link rel="stylesheet" href="v3.12.1/css/ol.css" type="text/css">
  <link rel="stylesheet" href="v3.12.1/examples/resources/layout.css" type="text/css">

  <link rel="stylesheet" href="v3.12.1/examples/resources/prism/prism.css" type="text/css">
  <script src="v3.12.1/examples/resources/zeroclipboard/ZeroClipboard.min.js"></script>
  <script src="https://cdn.polyfill.io/v2/polyfill.min.js?features=fetch"></script>
  <title>WMTS Tile Transitions</title>
 </head>
 <body>
  <!-- 
  bootstrap-combined.min.css, ol.css, layout.css,
  CSSファイルで設定されたセレクタを使用。
  -->
  <header class="navbar" role="navigation">
   <div class="container" id="navbar-inner-container">
    <!--
    <a class="navbar-brand" href="./"><img src="./resources/logo-70x70.png"> OpenLayers 3 Examples</a>
    -->
    <!-- ディレクトリ修正 -->
    <a class="navbar-brand" href="v3.12.1/examples/"><img src="v3.12.1/examples/resources/logo-70x70.png"> OpenLayers 3 Examples</a>
   </div>
  </header>
  <div class="container-fluid">
   <div class="row-fluid">
    <div class="span12">
     <h4 id="title">WMTS Tile Transitions</h4>
     <div id="map" class="map"></div>
     <label>
      Sea-level
      <input id="slider" type="range" value="10" max="100" min="-1">
     </label>
     <span id="theinfo"></span>
    </div>
   </div>
   <div class="row-fluid">
    <div class="span12">
     <p id="shortdesc">Example of smooth tile transitions when 
      changing the dimension of a WMTS layer. </p>
     <div id="docs"><p>Demonstrates smooth reloading 
      of layers when changing a dimension continously. The 
      demonstration layer is a global sea-level computation 
      (flooding computation from 
      <a href="http://scalgo.com">SCALGO</a>, 
      underlying data from 
      <a href="http://www.cgiar-csi.org/data/
      srtm-90m-digital-elevation-database-v4-1">
      CGIAR-CSI SRTM</a>) where cells that are flooded 
      if the sea-level rises to more than <em>x</em> 
      m are colored blue. The user selects the sea-level 
      dimension using a slider.</p>
     </div>
     <div id="api-links">Related API documentation: 
      <ul class="inline">
       <li>
        <!-- <a href="../apidoc/ol.Attribution.html" title="API documentation for ol.Attribution">ol.Attribution</a> -->
        <a href="v3.12.1/apidoc/ol.Attribution.html" title="API documentation for ol.Attribution">ol.Attribution</a>
       </li>,
       <li>
        <!-- <a href="../apidoc/ol.Map.html" title="API documentation for ol.Map">ol.Map</a> -->
        <a href="v3.12.1/apidoc/ol.Map.html" title="API documentation for ol.Map">ol.Map</a>
       </li>,
       <li>
        <!-- <a href="../apidoc/ol.View.html" title="API documentation for ol.View">ol.View</a> -->
        <a href="v3.12.1/apidoc/ol.View.html" title="API documentation for ol.View">ol.View</a>
       </li>,
       <li>
        <!-- <a href="../apidoc/ol.extent.html" title="API documentation for ol.extent">ol.extent</a> -->
        <a href="v3.12.1/apidoc/ol.extent.html" title="API documentation for ol.extent">ol.extent</a>
       </li>,
       <li>
        <!-- <a href="../apidoc/ol.layer.Tile.html" title="API documentation for ol.layer.Tile">ol.layer.Tile</a> -->
        <a href="v3.12.1/apidoc/ol.layer.Tile.html" title="API documentation for ol.layer.Tile">ol.layer.Tile</a>
       </li>,
       <li>
        <!-- <a href="../apidoc/ol.proj.html" title="API documentation for ol.proj">ol.proj</a> -->
        <a href="v3.12.1/apidoc/ol.proj.html" title="API documentation for ol.proj">ol.proj</a>
       </li>,
       <li>
        <!-- <a href="../apidoc/ol.source.OSM.html" title="API documentation for ol.source.OSM">ol.source.OSM</a> -->
        <a href="v3.12.1/apidoc/ol.source.OSM.html" title="API documentation for ol.source.OSM">ol.source.OSM</a>
       </li>,
       <li>
        <!-- <a href="../apidoc/ol.source.WMTS.html" title="API documentation for ol.source.WMTS">ol.source.WMTS</a> -->
        <a href="v3.12.1/apidoc/ol.source.WMTS.html" title="API documentation for ol.source.WMTS">ol.source.WMTS</a>
       </li>,
       <li>
        <!-- <a href="../apidoc/ol.tilegrid.WMTS.html" title="API documentation for ol.tilegrid.WMTS">ol.tilegrid.WMTS</a> -->
        <a href="v3.12.1/apidoc/ol.tilegrid.WMTS.html" title="API documentation for ol.tilegrid.WMTS">ol.tilegrid.WMTS</a>
       </li>
      </ui>
     </div>
    </div>
   </div>
   <div class="row-fluid">
    <div id="source-controls">
     <a id="copy-button">
      <i class="fa fa-clipboard"></i> Copy
     </a>
     <a id="jsfiddle-button">
      <i class="fa fa-jsfiddle"></i> Edit
     </a>
    </div>
    <form method="POST" id="jsfiddle-form" target="_blank" action="http://jsfiddle.net/api/post/jquery/1.11.0/">
    <textarea class="hidden" name="js">
// --- 省略 ---
&lt;/html&gt;</code></pre>
   </div>
  </div>
  <!--
  <script src="./resources/common.js"></script>
  <script src="./resources/prism/prism.min.js"></script>
  -->
  <!-- ディレクトリ修正
   CommonJS と
   prism.js
 -->
  <script src="v3.12.1/examples/resources/common.js"></script>
  <script src="v3.12.1/examples/resources/prism/prism.min.js"></script>
  <!-- 
  <script src="loader.js?id=wmts-dimensions"></script>
  -->
  <!-- ファイル修正 -->  <!-- ディレクトリ修正 -->
  <script src="loader.js?id=2142-ol3ex"></script>
  </body>
</html>


COMMONJS は

COMMONJS
http://webpack.github.io/docs/commonjs.html

に、次のようにあります。

The CommonJS group defined a module format to solve JavaScript scope issues by making sure each module is executed in its own namespace.
This is achieved by forcing modules to explicitly export those variables it wants to expose to the “universe”, and also by defining those other modules required to properly work.
To achieve this CommonJS give you two tools:
the require() function, which allows to import a given module into the current scope.
the module object, which allows to export something from the current scope.

CommonJSグループは、それ自身の名前空間内で実行されている各モジュールを確認することによって、JavaScriptのスコープ問題を解決するためのモジュールフォーマットを定義しました。
これは、それが「universe(?)」に公開したい変数を明示的にエクスポートするモジュールを強制することによって、同じように、正常に動作するのに必要な他のモジュールを定義することによって、達成されます。
この CommonJS を達成するために2つのツールを与えます:
require()関数、指定したモジュールを現在のスコープにインポートすることができます。
モジュールオブジェクト、現在のスコープからエクスポートすることができます。


Prism は、

Prism
http://prismjs.com/

に、次のようにあります。

Prism is a lightweight, extensible syntax highlighter, built with modern web standards in mind. It’s a spin-off from Dabblet and is tested there daily by thousands.
Prismは、最新のWeb標準に構築されたことを考慮し軽量で拡張可能なシンタックスハイライトです。それは Dabblet からスピンオフで、何千人も日々そこで試験されています。


ZeroClipboard は

ZeroClipboard v2.x
http://zeroclipboard.org/

に、次のようにあります。

The ZeroClipboard library provides an easy way to copy text to the clipboard using an invisible Adobe Flash movie and a JavaScript interface.
ZeroClipboard ライブラリは、見えない Adobe Flash ムービーとJavaScript のインターフェイスを使用してテキストをクリップボードにコピーする簡単な方法を提供します。

Debian 8 では動作しませんでした。ボタンを右クリックしたときに flash のコンテキストメニューが表示されると動作しています。

2015年3月26日木曜日

2 - ol3.3ex 93b - Canvas tiles example 2

「canvas-tiles.js(293-ol3ex.js)」は、マップを表示するための JavaScript ファイルです。

「293-ol3ex.js」
var map = new ol.Map({
 layers: [
  new ol.layer.Tile({
   source: new ol.source.OSM()
   /** ol.source.OSM 
    * Layer source for the OpenStreetMap tile server.
    * OpenStreetMap タイルサーバのレイヤソース。(ol3 API)
    */
  }),
  new ol.layer.Tile({
   source: new ol.source.TileDebug({
   /** ol.source.TileDebug
    * A pseudo tile source, which does not fetch 
    * tiles from a server, but renders a grid outline 
    * for the tile grid/projection along with the 
    * coordinates for each tile. See 
    * examples/canvas-tiles for an example.
    * Uses Canvas context2d, so requires Canvas 
    * support.
    * サーバからタイルを取ってこないが、各タイルの座標と
    * 一緒にタイルグリッド/投影法のグリッドのアウトライ
    * ンを描画する擬似タイルソース。例えば、
    * examples/canvas-tiles を参照してください。
    * キャンバス context2d を使用すると、キャンバスのサ
    * ポートを必要とします。(ol3 API)
    */
    projection: 'EPSG:3857',
    tileGrid: new ol.tilegrid.XYZ({
    /** ol.tilegrid.XYZ
     * Set the grid pattern for sources accessing XYZ 
     * tiled-image servers.
     * XYZタイル画像サーバにアクセスするソースのグリッ
     * ドパターンを設定します。(ol3 API)
     */
     maxZoom: 22
    })
   })
  })
 ],
 renderer: exampleNS.getRendererFromQueryString(),
/** 'example-behavior.js' により URL にある renderer を返します */
 target: 'map',
 controls: ol.control.defaults({
 /** controls
  * Controls initially added to the map. 
  * If not specified, ol.control.defaults() is used.
  * 初期設定で、マップに追加されたコントロール。
  * 明示されていなければ、ol.control.defaults() が使用されま
  * す。(ol3 API)
  */
 /** ol.control.defaults()
  * デフォルトでは、マップに含まコントロールのセット。
  * 特に設定しない限り、これは、以下の各コントロールの
  * インスタンスを含むコレクションを返します。(ol3 API)
  * ol.control.Zoom, ol.control.Rotate, ol.control.Attribution
  */
  attributionOptions: /** @type {olx.control.AttributionOptions} */ ({
  /** @type 
   * 値のタイプ(型)の説明 - 式などで表示
   * (@use JSDoc[http://usejsdoc.org/]より)
   */
   collapsible: false // 折りたたみ
  })
 }),
 view: new ol.View({
  center: ol.proj.transform(
   [-0.1275, 51.507222], 'EPSG:4326', 'EPSG:3857'),
  zoom: 10
 })
});

2 - ol3.3ex 93a - Canvas tiles example 1

「Canvas tiles example (canvas-tiles.html)」を参考に地図を表示してみます。
説明に次のようにあります。

Renders tiles with coordinates for debugging.
The black grid tiles are generated on the client with an HTML5 canvas. Note that the tile coordinates are ol3 normalized tile coordinates (origin bottom left), not OSM tile coordinates (origin top left).

デバッグのための座標を持つタイルをレンダリングします。
黒の格子タイルは HTML5 のキャンバスを使用してクライアントで生成されます。タイル座標が ol3 正規化タイル座標(元の左下)で、OSMタイル座標(元の左上)ではないことに注意してください。


HTML ファイルの作成
a Eclipse のメニューの「ファイル」->「ファイルを開く」をクリックします。


b 「ファイルを開く」ウィンドウで、「user」->「mapsite」->「ol3proj」->「v3.3.0」->「examples」->「canvas-tiles.html」をクリックして選択し、「OK」ボタンをクリックします。
同じように「canvas-tiles.js」を開きます。


c メニューの「ファイル」->「新規」 -> 「ファイル」をクリックします。


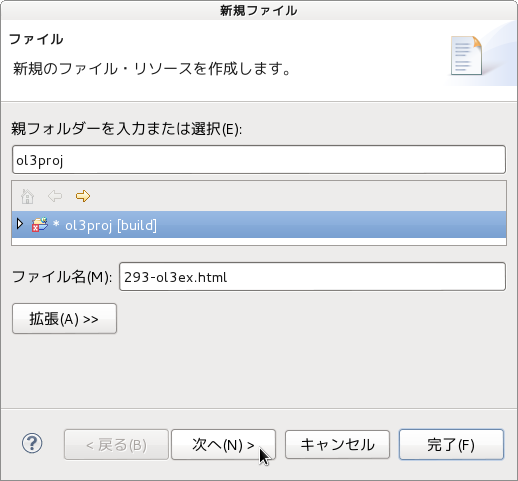
d 「ファイル」ウィンドウで「ol3proj」をクリックして選択し、「ファイル名」を「293-ol3ex.html」と入力し、「次へ」ボタンをクリックします。


e 「File Template」ウィンドウで「HTML 5 Template」をクリックして選択し、「OK」ボタンをクリックします。


f 「canvas-tiles.html」の内容をコピーして「293-ol3ex.html」に貼り付け、修正します。
g 同じように、新規に「293-ol3ex.js」ファイルを作成し、「File Template」ウィンドウで「JavaScript Template」をクリックして選択し、「完了」ボタンをクリックして、「canvas-tiles.js」の内容をコピーして貼り付け、修正します。「canvas-tiles-require.js」も「293-ol3ex-require.js」に貼り付けます。


「293-ol3ex.html」
<!doctype html>
<html lang="en">
 <head>
  <meta charset="utf-8">
  <meta http-equiv="X-UA-Compatible" content="chrome=1">
  <meta name="viewport" content="initial-scale=1.0, user-scalable=no, width=device-width">
<!--
  <link rel="stylesheet" href="../css/ol.css" type="text/css">
  <link rel="stylesheet" href="../resources/bootstrap/css/bootstrap.min.css" type="text/css">
  <link rel="stylesheet" href="../resources/layout.css" type="text/css">
  <link rel="stylesheet" href="../resources/bootstrap/css/bootstrap-responsive.min.css" type="text/css">
-->
  <!-- ディレクトリ修正 -->
  <link rel="stylesheet" href="v3.3.0/css/ol.css" type="text/css">
  <link rel="stylesheet" href="v3.3.0/resources/bootstrap/css/bootstrap.min.css" type="text/css">
  <link rel="stylesheet" href="v3.3.0/resources/layout.css" type="text/css">
  <link rel="stylesheet" href="v3.3.0/resources/bootstrap/css/bootstrap-responsive.min.css" type="text/css">
  <title>Canvas tiles example</title>
 </head>
 <body>
  <!-- 
  bootstrap.min.css, bootstrap-responsive.min.css で設定されたセレクタを使用。
  -->
  <div class="navbar navbar-inverse navbar-fixed-top">
   <div class="navbar-inner">
    <div class="container">
     <!--
     <a class="brand" href="./"><img src="../resources/logo.png"> OpenLayers 3 Examples</a>
     -->
     <!-- ディレクトリ修正 -->
     <a class="brand" href="v3.3.0/examples/"><img src="v3.3.0/resources/logo.png"> OpenLayers 3 Examples</a>
    </div>
   </div>
  </div>
  <div class="container-fluid">
   <div class="row-fluid">
    <div class="span12">
     <div id="map" class="map"></div>
    </div>
   </div>
   <div class="row-fluid">
    <div class="span12">
    <h4 id="title">Canvas tiles example</h4>
     <p id="shortdesc">Renders tiles with coordinates for 
      debugging.</p>
     <div id="docs">
      <p>The black grid tiles are generated on the client 
       with an HTML5 canvas. Note that the tile coordinates 
       are ol3 normalized tile coordinates (origin bottom 
       left), not OSM tile coordinates (origin top left).</p>
      <!--
      <p>See the <a href="canvas-tiles.js" target="_blank">canvas-tiles.js source</a> 
       to see how this is done.</p>
      -->
      <!-- ファイル修正 -->
      <p>See the <a href="293-ol3ex.js" target="_blank">293-ol3ex.js source</a> 
       to see how this is done.</p>
     </div>
     <div id="tags">layers, openstreetmap, canvas canvas, 
      sync, object</div>
    </div>
   </div>
  </div>
  <!--
  <script src="../resources/jquery.min.js" type="text/javascript"></script>
  <script src="../resources/example-behaviour.js" type="text/javascript"></script>
  -->
  <!-- ディレクトリ修正
   jQuery Minified版と
   example-behaviour.js(Examples用 JSコード[文字コードなど])
  -->
  <script src="v3.3.0/resources/jquery.min.js" type="text/javascript"></script>
  <script src="v3.3.0/resources/example-behaviour.js" type="text/javascript"></script>
  <!--
  <script src="loader.js?id=canvas-tiles" type="text/javascript"></script>
  -->
  <!-- ファイル修正 -->  <!-- ディレクトリ修正 -->
  <script src="loader.js?id=293-ol3ex" type="text/javascript"></script>
 </body>
</html>

2015年3月8日日曜日

2 - ol3.3ex 79b - Tiled ArcGIS MapServer example 2

「arcgis-tiled.js(279-ol3ex.js)」は、マップを表示するための JavaScript ファイルです。

Specialty/ESRI_StateCityHighway_USA (MapServer)
(http://sampleserver1.arcgisonline.com/ArcGIS/rest/services/Specialty/ESRI_StateCityHighway_USA/MapServer)
について次のようにあります。

Service Description: This service provides census information for U.S. cities and states including total population, racial counts, and more. It also includes highways. This is a sample service hosted by ESRI, powered by ArcGIS Server. ESRI has provided this example so that you may practice using ArcGIS APIs for JavaScript, Flex, and Silverlight. ESRI reserves the right to change or remove this service at any time and without notice.

サービスの説明:このサービスは、米国の都市と州の人口調査情報を提供し、総人口、人種カウント、およびその他多くを含みます。高速道路も含まれています。これは、ArcGIS Server による ESRI によってホストされているサンプルのサービスです。JavaScript、Flex、および Silverlight 用の ArcGIS API 使用することで練習できるように ESRI はこの例を提供してきました。 ESRI はいつでも変更、または、予告なしにこのサービスを削除する権利を留保します。


「279-ol3ex.js」
var url = 'http://sampleserver1.arcgisonline.com/ArcGIS/rest/services/' +
 'Specialty/ESRI_StateCityHighway_USA/MapServer';
var layers = [
 new ol.layer.Tile({
  /** ol.layer.Tile 
   * For layer sources that provide pre-rendered, tiled 
   * images in grids that are organized by zoom levels for 
   * specific resolutions. 
   * プリレンダリング(事前描画)を提供するレイヤソースのための、
   * 特定の解像度でのズームレベルによって編成されているグリッドの
   * タイルイメージ。(ol3 API)
   */
  source: new ol.source.MapQuest({layer: 'sat'})
  /** ol.source.MapQuest
   * Layer source for the MapQuest tile server.
   * MapQuest タイルサーバのレイヤソース。(ol3 API
   * 2 - ol3ex 23b - MapQuest example 2 参照)
   */
 }),
 new ol.layer.Tile({
  extent: [-13884991, 2870341, -7455066, 6338219],
  source: new ol.source.TileArcGISRest({
  /** ol.source.TileArcGISRest
   * Layer source for tile data from ArcGIS Rest 
   * services. Map and Image Services are supported.
   * For cached ArcGIS services, better performance 
   * is available using the ol.source.XYZ data 
   * source.
   * ArcGIS REST サービスからのタイルデータのレイヤソース。
   * 地図と画像サービスがサポートされています。キャッシュされた 
   * ArcGIS サービスのため、ol.source.XYZ データソースを
   * 使用することでより良いパフォーマンスが利用できます。
   * (ol3 API)
   */
   url: url
  })
 })
];
var map = new ol.Map({
 layers: layers,
 target: 'map',
 view: new ol.View({
  center: [-10997148, 4569099],
  zoom: 4
 })
});

2 - ol3.3ex 79a - Tiled ArcGIS MapServer example 1

「Tiled ArcGIS MapServer example (arcgis-tiled.html)」を参考に地図を表示してみます。


HTML ファイルの作成
a Eclipse のメニューの「ファイル」->「ファイルを開く」をクリックします。


b 「ファイルを開く」ウィンドウで、「user」->「mapsite」->「ol3proj」->「v3.3.0」->「examples」->「arcgis-tiled.html」をクリックして選択し、「OK」ボタンをクリックします。
同じように「arcgis-tiled.js」を開きます。


c メニューの「ファイル」->「新規」 -> 「ファイル」をクリックします。


d 「ファイル」ウィンドウで「ol3proj」をクリックして選択し、「ファイル名」を「279-ol3ex.html」と入力し、「次へ」ボタンをクリックします。


e 「File Template」ウィンドウで「HTML 5 Template」をクリックして選択し、「OK」ボタンをクリックします。


f 「arcgis-tiled.html」の内容をコピーして「279-ol3ex.html」に貼り付け、修正します。
g 同じように、新規に「279-ol3ex.js」ファイルを作成し、「File Template」ウィンドウで「JavaScript Template」をクリックして選択し、「完了」ボタンをクリックして、「arcgis-tiled.js」の内容をコピーして貼り付け、修正します。「arcgis-tiled-require.js」も「279-ol3ex-require.js」に貼り付けます。


「279-ol3ex.html」
<!doctype html>
<html lang="en">
 <head>
  <meta charset="utf-8">
  <meta http-equiv="X-UA-Compatible" content="chrome=1">
  <meta name="viewport" content="initial-scale=1.0, user-scalable=no, width=device-width">
<!--
  <link rel="stylesheet" href="../css/ol.css" type="text/css">
  <link rel="stylesheet" href="../resources/bootstrap/css/bootstrap.min.css" type="text/css">
  <link rel="stylesheet" href="../resources/layout.css" type="text/css">
  <link rel="stylesheet" href="../resources/bootstrap/css/bootstrap-responsive.min.css" type="text/css">
-->
  <!-- ディレクトリ修正 -->
  <link rel="stylesheet" href="v3.3.0/css/ol.css" type="text/css">
  <link rel="stylesheet" href="v3.3.0/resources/bootstrap/css/bootstrap.min.css" type="text/css">
  <link rel="stylesheet" href="v3.3.0/resources/layout.css" type="text/css">
  <link rel="stylesheet" href="v3.3.0/resources/bootstrap/css/bootstrap-responsive.min.css" type="text/css">
  <title>Tiled ArcGIS MapServer example</title>
 </head>
 <body>
  <!-- 
  bootstrap.min.css, bootstrap-responsive.min.css で設定されたセレクタを使用。
  -->
  <div class="navbar navbar-inverse navbar-fixed-top">
   <div class="navbar-inner">
    <div class="container">
     <!--
     <a class="brand" href="./"><img src="../resources/logo.png"> OpenLayers 3 Examples</a>
     -->
     <!-- ディレクトリ修正 -->
     <a class="brand" href="v3.3.0/examples/"><img src="v3.3.0/resources/logo.png"> OpenLayers 3 Examples</a>
    </div>
   </div>
  </div>
  <div class="container-fluid">
   <div class="row-fluid">
    <div class="span12">
     <div id="map" class="map"></div>
    </div>
   </div>
   <div class="row-fluid">
    <div class="span12">
    <h4 id="title">Tiled ArcGIS MapServer example</h4>
     <p id="shortdesc">Example of a tiled ArcGIS layer.</p>
     <div id="docs">
      <!--
      <p>See the <a href="arcgis-tiled.js" target="_blank">arcgis-tiled.js source</a> to see how this is done.</p>
      -->
      <!-- ファイル修正 -->
      <p>See the <a href="279-ol3ex.js" target="_blank">279-ol3ex.js source</a> to see how this is done.</p>
     </div>
     <div id="tags">arcgis, tile, tilelayer</div>
    </div>
   </div>
  </div>
  <!--
  <script src="../resources/jquery.min.js" type="text/javascript"></script>
  <script src="../resources/example-behaviour.js" type="text/javascript"></script>
  -->
  <!-- ディレクトリ修正
   jQuery Minified版と
   example-behaviour.js(Examples用 JSコード[文字コードなど])
  -->
  <script src="v3.3.0/resources/jquery.min.js" type="text/javascript"></script>
  <script src="v3.3.0/resources/example-behaviour.js" type="text/javascript"></script>
  <!--
  <script src="loader.js?id=arcgis-tiled" type="text/javascript"></script>
  -->
  <!-- ファイル修正 -->  <!-- ディレクトリ修正 -->
  <script src="loader.js?id=279-ol3ex" type="text/javascript"></script>
 </body>
</html>

2015年2月16日月曜日

2 - ol3.2ex 61a - WMS GetFeatureInfo example (tile layer) 1

「WMS GetFeatureInfo example (tile layer)(getfeatureinfo-tile.html)」を参考に地図を表示してみます。


HTML ファイルの作成
a Eclipse のメニューの「ファイル」->「ファイルを開く」をクリックします。


b 「ファイルを開く」ウィンドウで、「user」->「mapsite」->「ol3proj」->「v3.2.0」->「examples」->「getfeatureinfo-tile.html」をクリックして選択し、「OK」ボタンをクリックします。
同じように「getfeatureinfo-tile.js」を開きます。


c メニューの「ファイル」->「新規」 -> 「ファイル」をクリックします。


d 「ファイル」ウィンドウで「ol3proj」をクリックして選択し、「ファイル名」を「261-ol3ex.html」と入力し、「次へ」ボタンをクリックします。


e 「File Template」ウィンドウで「HTML 5 Template」をクリックして選択し、「OK」ボタンをクリックします。


f 「getfeatureinfo-tile.html」の内容をコピーして「261-ol3ex.html」に貼り付け、修正します。
g 同じように、新規に「261-ol3ex.js」ファイルを作成し、「File Template」ウィンドウで「JavaScript Template」をクリックして選択し、「完了」ボタンをクリックして、「getfeatureinfo-tile.js」の内容をコピーして貼り付け、修正します。「getfeatureinfo-tile-require.js」も「261-ol3ex-require.js」に貼り付けます。


「261-ol3ex.html」
<!doctype html>
<html lang="en">
 <head>
  <meta charset="utf-8">
  <meta http-equiv="X-UA-Compatible" content="chrome=1">
  <meta name="viewport" content="initial-scale=1.0, user-scalable=no, width=device-width">
<!--
  <link rel="stylesheet" href="../css/ol.css" type="text/css">
  <link rel="stylesheet" href="../resources/bootstrap/css/bootstrap.min.css" type="text/css">
  <link rel="stylesheet" href="../resources/layout.css" type="text/css">
  <link rel="stylesheet" href="../resources/bootstrap/css/bootstrap-responsive.min.css" type="text/css">
-->
  <!-- ディレクトリ修正 -->
  <link rel="stylesheet" href="v3.2.0/css/ol.css" type="text/css">
  <link rel="stylesheet" href="v3.2.0/resources/bootstrap/css/bootstrap.min.css" type="text/css">
  <link rel="stylesheet" href="v3.2.0/resources/layout.css" type="text/css">
  <link rel="stylesheet" href="v3.2.0/resources/bootstrap/css/bootstrap-responsive.min.css" type="text/css">
  <title>WMS GetFeatureInfo example (tile layer)</title>
 </head>
 <body>
  <!-- 
  bootstrap.min.css, bootstrap-responsive.min.css で設定されたセレクタを使用。
  -->
  <div class="navbar navbar-inverse navbar-fixed-top">
   <div class="navbar-inner">
    <div class="container">
     <!--
     <a class="brand" href="./"><img src="../resources/logo.png"> OpenLayers 3 Examples</a>
     -->
      <!-- ディレクトリ修正 -->
     <a class="brand" href="v3.2.0/examples/"><img src="v3.2.0/resources/logo.png"> OpenLayers 3 Examples</a>
    </div>
   </div>
  </div>
  <div class="container-fluid">
   <div class="row-fluid">
    <div class="span12">
     <div id="map" class="map"></div>
    </div>
   </div>
   <div class="row-fluid">
    <div class="span4">
     <h4 id="title">WMS GetFeatureInfo example (tile layer)</h4>
     <p id="shortdesc">This example shows how to trigger 
      WMS GetFeatureInfo requests on click for a WMS tile 
      layer.</p>
     <div id="docs">
      <p>Additionally <code>map.forEachLayerAtPixel</code> 
       is used to change the mouse pointer when hovering a 
       non-transparent pixel n the map.</p>
      <!--
      See the <a href="getfeatureinfo-tile.js" target="_blank">getfeatureinfo-tile.js source</a> to see how this is done.</p>
      -->
      <!-- ファイル修正 -->
      See the <a href="261-ol3ex.js" target="_blank">261-ol3ex.js source</a> to see how this is done.</p>
     </div>
     <div id="tags">getfeatureinfo, forEachLayerAtPixel</div>
    </div>
    <div class="span4 offset4">
     <div id="info" class="alert alert-success">
      &nbsp;
     </div>
    </div>
   </div>
  </div>
  <!--
  <script src="../resources/jquery.min.js" type="text/javascript"></script>
  <script src="../resources/example-behaviour.js" type="text/javascript"></script>
  -->
  <!-- ディレクトリ修正
   jQuery Minified版と
   example-behaviour.js(Examples用 JSコード[文字コードなど])
  -->
  <script src="v3.2.0/resources/jquery.min.js" type="text/javascript"></script>
  <script src="v3.2.0/resources/example-behaviour.js" type="text/javascript"></script>
  <!--
  <script src="loader.js?id=getfeatureinfo-tile" type="text/javascript"></script>
  -->
  <!-- ファイル修正 -->  <!-- ディレクトリ修正 -->
  <script src="loader.js?id=261-ol3ex" type="text/javascript"></script>
 </body>
</html>