2018年4月30日月曜日

Leaflet 1.3 - 4-4 Using GeoJSON with Leaflet

4-4 Using GeoJSON with Leaflet

Using GeoJSON with Leaflet
Leaflet で GeoJSON を使用する

GeoJSON is becoming a very popular data format among many GIS technologies and services — it's simple, lightweight, straightforward, and Leaflet is quite good at handling it. In this example, you'll learn how to create and interact with map vectors created from GeoJSON objects.

GeoJSON は、多くの GIS テクノロジとサービスの間でとても人気のあるデータフォーマットになっています - それは簡易で、軽量、明快、そして、Leaflet はそれを扱うのにかなりよいものです。この例では、GeoJSON オブジェクトから作成されるマップベクタを作成し対話する方法を学習します。


About GeoJSON
GeoJSON について

According to http://geojson.org:
http://geojson.org より

GeoJSON is a format for encoding a variety of geographic data structures. A GeoJSON object may represent a geometry, a feature, or a collection of features. GeoJSON supports the following geometry types: Point, LineString, Polygon, MultiPoint, MultiLineString, MultiPolygon, and GeometryCollection. Features in GeoJSON contain a geometry object and additional properties, and a feature collection represents a list of features.

GeoJSON は、様々な地理情報データ構造をエンコードするためのフォーマットです。GeoJSON オブジェクトは、ジオメトリ、または、フィーチャ、フィーチャのコレクションを表わすことができます。GeoJSON は、次のジオメトリタイプ:ポイント、および、ラインストリング、ポリゴン、マルチポイント、マルチラインストリング、マルチポイント、ジオメトリコッレクションをサポートします。GeoJSON のフィーチャは、ジオメトリオブジェクトと付加プロパティを含み、そして、フィーチャコレクションは、フィーチャのリストを表わします。

Leaflet supports all of the GeoJSON types above, but Features and FeatureCollections work best as they allow you to describe features with a set of properties. We can even use these properties to style our Leaflet vectors. Here's an example of a simple GeoJSON feature:

Leaflet は、上記全ての GeoJSON タイプをサポートします、しかし、Feature(Feature Object[REF 7946-The GeoJSON Format(https://tools.ietf.org/html/rfc7946#section-3.2)])と FeatureCollection(FeatureCollections Object[REF 7946-The GeoJSON Format(https://tools.ietf.org/html/rfc7946#section-3.3)])は、プロパティの設定とともにフィーチャを描画することができるので、最もよい動作をします。Leaflet ベクタのスタイルを決めるためにこれらのプロパティを使用することさえできます。これは簡単な GeoJSON フィーチャの例です:
var geojsonFeature = {
 "type": "Feature",
 "properties": {
  "name": "Coors Field",
  "amenity": "Baseball Stadium",
  "popupContent": "This is where the Rockies play!"
 },
 "geometry": {
  "type": "Point",
  "coordinates": [-104.99404, 39.75621]
 }
};

The GeoJSON layer

GeoJSON objects are added to the map through a GeoJSON layer[Leaflet API(http://leafletjs.com/reference-1.3.0.html#geojson)]. To create it and add it to a map, we can use the following code:

GeoJSON オブジェクトは、GeoJSON レイヤを通してマップに追加されます。それを作成して追加するために、次のコードを使用できます:
L.geoJSON(geojsonFeature).addTo(map);


GeoJSON objects may also be passed as an array of valid GeoJSON objects.

GeoJSON オブジェクトは、有効な GeoJSON オブジェクトの配列として渡すこともできます。
var myLines = [{
 "type": "LineString",
 "coordinates": [[-100, 40], [-105, 45], [-110, 55]]
}, {
 "type": "LineString",
 "coordinates": [[-105, 40], [-110, 45], [-115, 55]]
}];

 訳注:
上記 myLines を map に追加するには次のコードも追加してください。
L.geoJSON(myLines).addTo(map);

また、map のズームも初期設定を 3 に変更します。
var map = L.map('map').setView([39.74739, -105], 3);

Alternatively, we could create an empty GeoJSON layer and assign it to a variable so that we can add more features to it later.

あるいは、GeoJSON レイヤにさらにフィーチャを追加するために、空の GeoJSON レイヤを作成し、それに変数を割り当てます。
var myLayer = L.geoJSON().addTo(map);
myLayer.addData(geojsonFeature);

Options

style

The style option can be used to style features two different ways. First, we can pass a simple object that styles all paths (polylines and polygons) the same way:

スタイル(style)オプションは、フィーチャを2つの違う方法でスタイルを決めるために使用されます。最初に、2つのパス(ポリラインとポリゴンを)同じ方法でスタイルを決める簡単なオブジェクトを渡すことができます:

var myLines = [{
 "type": "LineString",
 "coordinates": [[-100, 40], [-105, 45], [-110, 55]]
}, {
 "type": "LineString",
 "coordinates": [[-105, 40], [-110, 45], [-115, 55]]
}];

var myStyle = {
 "color": "#ff7800",
 "weight": 5,
 "opacity": 0.65
};

L.geoJSON(myLines, {
 style: myStyle
}).addTo(map);


Alternatively, we can pass a function that styles individual features based on their properties. In the example below we check the "party" property and style our polygons accordingly:

あるいは、プロパティを基本としたここのフィーチャのスタイルを決めるファンクションを渡すことができます。下記の例では、"party" プロパティを確認し、それに応じてポリゴンのスタイルを決めます。
var states = [{
 "type": "Feature",
 "properties": {"party": "Republican"},
 "geometry": {
  "type": "Polygon",
  "coordinates": [[
   [-104.05, 48.99],
   [-97.22,  48.98],
   [-96.58,  45.94],
   [-104.03, 45.94],
   [-104.05, 48.99]
  ]]
 }

}, {
 "type": "Feature",
  "properties": {"party": "Democrat"},
  "geometry": {
   "type": "Polygon",
   "coordinates": [[
     [-109.05, 41.00],
     [-102.06, 40.99],
     [-102.03, 36.99],
     [-109.04, 36.99],
     [-109.05, 41.00]
   ]]
  }
}];

L.geoJSON(states, {
 style: function(feature) {
  switch (feature.properties.party) {
   case 'Republican': return {color: "#ff0000"};
   case 'Democrat':   return {color: "#0000ff"};
  }
 }
}).addTo(map);


pointToLayer

Points are handled differently than polylines and polygons. By default simple markers are drawn for GeoJSON Points. We can alter this by passing a pointToLayer function in a GeoJSON options object when creating the GeoJSON layer. This function is passed a LatLng and should return an instance of ILayer, in this case likely a Marker or CircleMarker.

ポイント(point)は、ポリライン(polyline)やポリゴン(polygon)と違った取扱がされています。GeoJSON レイヤを作成するとき、GeoJSON options(Leaflet API[http://leafletjs.com/reference-1.3.0.html#geojson])オブジェクトで pointToLayer ファンクションに渡すことによって、これを変更できます。このファンクションは、 LatLng(Leaflet API[http://leafletjs.com/reference-1.3.0.html#latlng])を渡し、この場合 Marker(Leaflet API[http://leafletjs.com/reference-1.3.0.html#marker])や CircleMarker(Leaflet API[http://leafletjs.com/reference-1.3.0.html#circlemarker])のように、ILayer のインスタンスを返さなければなりません。

Here we're using the pointToLayer option to create a CircleMarker:

ここで、CircleMarker を作成するために pointToLayer オプションを使用します。
var geojsonMarkerOptions = {
 radius: 8,
 fillColor: "#ff7800",
 color: "#000",
 weight: 1,
 opacity: 1,
 fillOpacity: 0.8
};

L.geoJSON(someGeojsonFeature, {
 pointToLayer: function (feature, latlng) {
  return L.circleMarker(latlng, geojsonMarkerOptions);
 }
}).addTo(map);


訳注:geojsonFeature の map への追加コードをコメントアウトし、上記コードの「someGeojsonFeature」を「geojsonFeature」に変更します。
// L.geoJSON(geojsonFeature).addTo(map);
---
L.geoJSON(geojsonFeature, {
 pointToLayer: function (feature, latlng) {
  return L.circleMarker(latlng, geojsonMarkerOptions);
 }
}).addTo(map);
---


We could also set the style property in this example — Leaflet is smart enough to apply styles to GeoJSON points if you create a vector layer like circle inside the pointToLayer function.

この例では、スタイルプロパティも設定できます - もし、pointToLayer ファンクション内でサークル(circle)のようなベクタレイヤを作成するなら、Leaflet は、GeoJSON ポイント(point)にスタイルを適用するのに十分な性能があります。


onEachFeature

The onEachFeature option is a function that gets called on each feature before adding it to a GeoJSON layer. A common reason to use this option is to attach a popup to features when they are clicked.

onEachFeature オプションは、GeoJSON レイヤにフィーチャを追加する前に、各フィーチャが呼び出されるファンクションです。このオプションを使用する一般的な理由は、フィーチャがクリックされるときポップアップをフィーチャに装着するためです。

function onEachFeature(feature, layer) {
 // does this feature have a property named popupContent?
 if (feature.properties && feature.properties.popupContent) {
  layer.bindPopup(feature.properties.popupContent);
 }
}

var geojsonFeature = {
 "type": "Feature",
 "properties": {
  "name": "Coors Field",
  "amenity": "Baseball Stadium",
  "popupContent": "This is where the Rockies play!"
 },

 "geometry": {
  "type": "Point",
  "coordinates": [-104.99404, 39.75621]
 }
};

L.geoJSON(geojsonFeature, {
 onEachFeature: onEachFeature
}).addTo(map);


filter

The filter option can be used to control the visibility of GeoJSON features. To accomplish this we pass a function as the filter option. This function gets called for each feature in your GeoJSON layer, and gets passed the feature and the layer. You can then utilise the values in the feature's properties to control the visibility by returning true or false.

filter オプションは、GeoJSON フィーチャの可視性を制御するために使用されます。これを達成するために filter オプションとしてファンクションを渡します。このファンクションは、GeoJSON レイヤの各フィーチャが呼び出され、フィーチャとレイヤを渡されます。それから、true と false を返すことによって可視性を制御するために、フィーチャのプロパティで値を利用できます。

In the example below "Busch Field" will not be shown on the map.

下記の例で、"Busch Field" は表示されません。
var someFeatures = [{
 "type": "Feature",
 "properties": {
  "name": "Coors Field",
  "show_on_map": true
 },
 "geometry": {
  "type": "Point",
  "coordinates": [-104.99404, 39.75621]
 }

}, {
 "type": "Feature",
  "properties": {
   "name": "Busch Field",
   "show_on_map": false
  },
  "geometry": {
   "type": "Point",
   "coordinates": [-104.98404, 39.74621]
  }
}];

L.geoJSON(someFeatures, {
 filter: function(feature, layer) {
  return feature.properties.show_on_map;
 }
}).addTo(map);

View the example page to see in detail what is possible with the GeoJSON layer.

GeoJSON レイヤで可能なことを詳細で見るために例のページをみてみます。

全コード
<!DOCTYPE html>
<html>
 <head>
  <meta charset="UTF-8">
  <link rel="stylesheet" href="./leaflet13/leaflet.css" />
  <script src="./leaflet13/leaflet.js"></script>
  <title>Using GeoJSON with Leaflet</title>
 </head>
 <body>
  <div id="map" style="width: 600px; height: 400px;"></div>
  <script>
  //Setting up the map
   var map = L.map('map').setView([39.74739, -105], 3);
   
   L.tileLayer('https://{s}.tile.openstreetmap.org/{z}/{x}/{y}.png', {
  attribution: 'Map data © <a href="https://www.openstreetmap.org/copyright">OpenStreetMap</a> contributors'
   }).addTo(map);
   //onEachFeature
   function onEachFeature(feature, layer) {
    // does this feature have a property named popupContent?
    if (feature.properties && feature.properties.popupContent) {
     layer.bindPopup(feature.properties.popupContent);
    }
   }
   //About GeoJSON
   var geojsonFeature = {
    "type": "Feature",
    "properties": {
     "name": "Coors Field",
     "amenity": "Baseball Stadium",
     "popupContent": "This is where the Rockies play!"
    },
    "geometry": {
     "type": "Point",
     "coordinates": [-104.99404, 39.75621]
    }
   };
   //The GeoJSON layer
   // L.geoJSON(geojsonFeature).addTo(map);
   
   // var myLayer = L.geoJSON().addTo(map);
   // myLayer.addData(geojsonFeature);

   //onEachFeature
   // L.geoJSON(geojsonFeature, {
   //  onEachFeature: onEachFeature
   // }).addTo(map);
   //The GeoJSON layer
   var myLines = [{
    "type": "LineString",
    "coordinates": [[-100, 40], [-105, 45], [-110, 55]]
    }, {
    "type": "LineString",
    "coordinates": [[-105, 40], [-110, 45], [-115, 55]]
   }];
   
   // L.geoJSON(myLines).addTo(map);
   //Option

   //style
   var myStyle = {
    "color": "#ff7800",
    "weight": 5,
    "opacity": 0.65
   };

   L.geoJSON(myLines, {
    style: myStyle
   }).addTo(map);
   var states = [{
    "type": "Feature",
    "properties": {"party": "Republican"},
    "geometry": {
     "type": "Polygon",
     "coordinates": [[
       [-104.05, 48.99],
       [-97.22,  48.98],
       [-96.58,  45.94],
       [-104.03, 45.94],
       [-104.05, 48.99]
      ]]
     }
    }, {
    "type": "Feature",
    "properties": {"party": "Democrat"},
    "geometry": {
     "type": "Polygon",
     "coordinates": [[
       [-109.05, 41.00],
       [-102.06, 40.99],
       [-102.03, 36.99],
       [-109.04, 36.99],
       [-109.05, 41.00]
     ]]
    }
   }];
   L.geoJSON(states, {
    style: function(feature) {
     switch (feature.properties.party) {
      case 'Republican': return {color: "#ff0000"};
      case 'Democrat':   return {color: "#0000ff"};
     }
    }
   }).addTo(map);
   //pointToLayer
   var geojsonMarkerOptions = {
    radius: 8,
    fillColor: "#ff7800",
    color: "#000",
    weight: 1,
    opacity: 1,
    fillOpacity: 0.8
   };
   L.geoJSON(geojsonFeature, {
    pointToLayer: function (feature, latlng) {
     return L.circleMarker(latlng, geojsonMarkerOptions);
    }
   }).addTo(map);
   //filter
   var someFeatures = [{
    "type": "Feature",
    "properties": {
     "name": "Coors Field",
     "show_on_map": true
    },
    "geometry": {
     "type": "Point",
     "coordinates": [-104.99404, 39.75621]
    }
   }, {
    "type": "Feature",
    "properties": {
     "name": "Busch Field",
     "show_on_map": false
    },
    "geometry": {
     "type": "Point",
     "coordinates": [-104.98404, 39.74621]
    }
   }];
   L.geoJSON(someFeatures, {
    filter: function(feature, layer) {
     return feature.properties.show_on_map;
    }
   }).addTo(map);
  </script>
 </body>
</html>

2018年4月17日火曜日

Leaflet 1.3 - 4-3 Markers With Custom Icons

4-3 Markers With Custom Icons
Markers With Custom Icons
カスタムアイコンを使用するマーカ

In this tutorial, you’ll learn how to easily define your own icons for use by the markers you put on the map.

このチュートリアルでは、マップに置くマーカを使うために自分のアイコンを簡単に定義する方法を学びます。

Preparing the images
画像の準備

To make a custom icon, we usually need two images — the actual icon image and the image of its shadow. For this tutorial, we took the Leaflet logo and created four images out of it — 3 leaf images of different colors and one shadow image for the three:

カスタムアイコンを作成するために、通常、2個の画像 - 実像のアイコン画像とその影画像 - が必要です。このチュートリアルのために、Leaflet ロゴを持ってきて、それから4個の画像 - 違う色の3個の葉と3個のための影の画像 - を作成しました:

Note that the white area in the images is actually transparent.

画像の余白は実際には透明であるということが重要です。


Creating an icon
アイコンの作成

Marker icons in Leaflet are defined by L.Icon objects, which are passed as an option when creating markers. Let’s create a green leaf icon:

Leaflet では、マーカアイコンは L.Icon オブジェクトによって定義されていて、マーカを作成したときにオプションとして渡されます。緑色の葉のアイコンを作成しましょう:
var greenIcon = L.icon({
 iconUrl: 'leaf-green.png',
 shadowUrl: 'leaf-shadow.png',

 iconSize:     [38, 95], // size of the icon
 shadowSize:   [50, 64], // size of the shadow
 iconAnchor:   [22, 94], // point of the icon which will correspond to marker's location
 // マーカの位置に対応するアイコンの点
 shadowAnchor: [4, 62],  // the same for the shadow
 popupAnchor:  [-3, -76] // point from which the popup should open relative to the iconAnchor
 // iconAnchor 基準にしたポップアップを開く点
});

Now putting a marker with this icon on a map is easy:

これで、マップ上にこのアイコンでマーカを配置することは簡単です:
L.marker([51.5, -0.09], {icon: greenIcon}).addTo(map);


Defining an icon class
アイコン(icon)クラスの定義

What if we need to create several icons that have lots in common? Let’s define our own icon class containing the shared options, inheriting from L.Icon! It’s really easy in Leaflet:

もし、たくさんの共通に持ついくつかのアイコンを作成する必要があるとしたら?L.Icon から継承される、共有オプションを含む自作アイコンクラスを定義しましょう。Leaflet では本当に簡単です:
var LeafIcon = L.Icon.extend({
 options: {
  shadowUrl: 'leaf-shadow.png',
  iconSize:     [38, 95],
  shadowSize:   [50, 64],
  iconAnchor:   [22, 94],
  shadowAnchor: [4, 62],
  popupAnchor:  [-3, -76]
 }
});

Now we can create all three of our leaf icons from this class and use them:

これで、このクラスから3個の自作の leaf アイコン全てを作成し使用できます:
var greenIcon = new LeafIcon({iconUrl: 'leaf-green.png'}),
 redIcon = new LeafIcon({iconUrl: 'leaf-red.png'}),
 orangeIcon = new LeafIcon({iconUrl: 'leaf-orange.png'});

You may have noticed that we used the new keyword for creating LeafIcon instances. So why do all Leaflet classes get created without it? The answer is simple: the real Leaflet classes are named with a capital letter (e.g. L.Icon), and they also need to be created with new, but there are also shortcuts with lowercase names (L.icon), created for convenience like this:

LeafIcon インスタンスを作成するために、new キーワードを使用したということに注意します。全ての Leaflet クラスがそれなしに作成されるのはなぜでしょうか。答えは簡単です:実際の Leaflet クラスは、大文字(例えば L.Icon)で名付けます、そして、new を使用して作成される必要もあり、小文字の名前(L.icon)のショートカットもありますが、便宜上このように作成されます:
L.icon = function (options) {
 return new L.Icon(options);
};

You can do the same with your classes too. OK, lets finally put some markers with these icons on the map:

自身のクラスで同じことができもできます。最後に、マップ上にこれらのアイコンでマーカを配置しましょう:
L.marker([51.5, -0.09], {icon: greenIcon}).addTo(map).bindPopup("I am a green leaf.");
L.marker([51.495, -0.083], {icon: redIcon}).addTo(map).bindPopup("I am a red leaf.");
L.marker([51.49, -0.1], {icon: orangeIcon}).addTo(map).bindPopup("I am an orange leaf.");


That’s it. Now take a look at the full example, the L.Icon docs, or browse other examples.

これで完成です。それでは、完全な例、または、L.Icon ドキュメント、他の例の閲覧をみてみましょう。


全コード
<!DOCTYPE html>
<html>
 <head>
  <meta charset="UTF-8">
  <link rel="stylesheet" href="./leaflet13/leaflet.css" />
  <script src="./leaflet13/leaflet.js"></script>
  <title>Markers With Custom Icons</title>
 </head>
 <body>
  <div id="map" style="width: 600px; height: 400px;"></div>
  <script>
  // Setting up the map
   var map = L.map('map').setView([51.505, -0.09], 13);
   
   L.tileLayer('https://{s}.tile.openstreetmap.org/{z}/{x}/{y}.png', {
  attribution: 'Map data &copy; <a href="https://www.openstreetmap.org/copyright">OpenStreetMap</a> contributors'
   }).addTo(map);
   // Creating an icon
   /**
   var greenIcon = L.icon({
    iconUrl: 'leaf-green.png',
    shadowUrl: 'leaf-shadow.png',

    iconSize:     [38, 95], // size of the icon
    shadowSize:   [50, 64], // size of the shadow
    iconAnchor:   [22, 94], // point of the icon which will correspond to marker's location
    shadowAnchor: [4, 62],  // the same for the shadow
    popupAnchor:  [-3, -76] // point from which the popup should open relative to the iconAnchor
   });
   
   L.marker([51.5, -0.09], {icon: greenIcon}).addTo(map);
   */
   // Defining an icon class
   var LeafIcon = L.Icon.extend({
    options: {
     shadowUrl: 'leaf-shadow.png',
     iconSize:     [38, 95],
     shadowSize:   [50, 64],
     iconAnchor:   [22, 94],
     shadowAnchor: [4, 62],
     popupAnchor:  [-3, -76]
    }
   });
   var greenIcon = new LeafIcon({iconUrl: 'leaf-green.png'}),
       redIcon = new LeafIcon({iconUrl: 'leaf-red.png'}),
       orangeIcon = new LeafIcon({iconUrl: 'leaf-orange.png'});
   L.icon = function (options) {
    return new L.Icon(options);
   };
   L.marker([51.5, -0.09], {icon: greenIcon}).addTo(map).bindPopup("I am a green leaf.");
   L.marker([51.495, -0.083], {icon: redIcon}).addTo(map).bindPopup("I am a red leaf.");
   L.marker([51.49, -0.1], {icon: orangeIcon}).addTo(map).bindPopup("I am an orange leaf.");
  </script>
 </body>
</html>
2018年4月12日木曜日

Leaflet 1.3 - 4-2 Leaflet on Mobile

4-2 Leaflet on Mobile
Leaflet on Mobile

In this example, you’ll learn how to create a fullscreen map tuned for mobile devices like iPhone, iPad or Android phones, and how to easily detect and use the current user location.

この例では、iPhone や iPad、Android フォンのようなモバイル機器に調整されたフルスクリーンマップを作成する方法、および、現在のユーザの位置を検出し使用する方法を学習します。

Preparing the page
ページの準備

First we’ll take a look at the HTML & CSS code of the page. To make our map div element stretch to all available space (fullscreen), we can use the following CSS code (note: In this example we use percentage for height. While vh is arguably better, due to a bug with Google Chrome on mobile.):

最初に、ページの HTML と CSS のコードをみてみます。map div エレメントを全ての有効な場所(fullscreen)に伸ばすために、次の CSS コードを使用できます(重要:この例では、高さにパーセントを使用します。一方、モバイル版 Google Chrome のバグのため、vh がおそらく望ましいです)。
body {
 padding: 0;
 margin: 0;
}
html, body, #map {
 height: 100%;
 width: 100vw;
}
Also, we need to tell the mobile browser to disable unwanted scaling of the page and set it to its actual size by placing the following line in the head section or our HTML page:

同じように、望ましくないスケールを禁止すること、および、head セクション、または、HTML ページに次のラインを置くことによって実際のサイズに設定することをモバイルブラウザに通知する必要があります:
<meta name="viewport" content="width=device-width, initial-scale=1.0, maximum-scale=1.0, user-scalable=no" />

Initializing the map
マップの初期設定

We’ll now initialize the map in the JavaScript code like we did in the quick start guide, showing the whole world:

初めに、全世界を表示するために、quick start guide でしたように、JavaScript コードでマップを初期設定します。
var map = L.map('map').fitWorld();

L.tileLayer('https://api.tiles.mapbox.com/v4/MapID/997/256/{z}/{x}/{y}.png?access_token={accessToken}', {
 attribution: 'Map data &copy; <a href="http://openstreetmap.org">OpenStreetMap</a> contributors, <a href="http://creativecommons.org/licenses/by-sa/2.0/">CC-BY-SA</a>, Imagery &copy <a href="http://mapbox.com">Mapbox</a>',
  maxZoom: 18
}).addTo(map);

Geolocation
地理位置情報

Leaflet has a very handy shortcut for zooming the map view to the detected location — locate method with the setView option, replacing the usual setView method in the code:

Leaflet は、検出位置にマップビューの焦点を当てるため、とても取り扱いやすいショートカット - setView オプションがある locate メッソド - があり、コードで通常の setView メソッドを置き換えます:
map.locate({setView: true, maxZoom: 16});
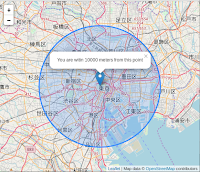
Here we specify 16 as the maximum zoom when setting the map view automatically. As soon as the user agrees to share its location and it’s detected by the browser, the map will set the view to it. Now we have a working fullscreen mobile map! But what if we need to do something after the geolocation completed? Here’s what the locationfound and locationerror events are for. Let’s for example add a marker in the detected location, showing accuracy in a popup, by adding an event listener to locationfound event before the locateAndSetView call:

ここで、マップビューを自動的に設定するとき最大ズームとして16を指定します。ユーザがその位置を共有し、そして、ブラウザによって検出されることを同意するとすぐに、マップはビューにそれを設定します。これで、fullscreen モバイルマップが動作します。しかし、地理位置情報が実行された後、何かすることが必要な場合はどうなるのでしょうか。locationfound と locationerror があるのはここです。locateAndSetView を呼び出す前にイベントリスナを locationfound に追加することによって、検出された位置に、ポップアップに accuracy(Accuracy of location in meters. メートル単位の位置の正確さ。:Leaflet API)を表示する、マーカを追加する例をみてみましょう。
function onLocationFound(e) {
 var radius = e.accuracy / 2;

 L.marker(e.latlng).addTo(map)
  .bindPopup("You are within " + radius + " meters from this point").openPopup();

 L.circle(e.latlng, radius).addTo(map);
}

map.on('locationfound', onLocationFound);
Excellent! But it would also be nice to show an error message if the geolocation failed:

素晴らしい!しかし、地理位置情報が欠けたら、エラーメッセージを表示することも良いところです:
function onLocationError(e) {
 alert(e.message);
}

map.on('locationerror', onLocationError);
If you have setView option set to true and the geolocation failed, it will set the view to the whole world.

もし、setView オプションを true に設定し、そして、地理位置情報が欠けたら、ビューを全世界に設定します。

Now the example is complete — try it on your mobile phone: View the full example →

これで、例は完成です - モバイルフォンで試します:完全な例を見る ->


Next steps would be to take a look at the detailed documentation and browse other examples.

次のステップは、詳細なドキュメントを確認し、そして、他の例を閲覧してください。


全コード
<!DOCTYPE html>
<html>
 <head>
  <meta charset="UTF-8">
  <!-- Preparing the page -->
  <meta name="viewport" content="width=device-width, initial-scale=1.0, maximum-scale1.0, user-scalable=no" />
  <link rel="stylesheet" href="./leaflet13/leaflet.css" />
  <script src="./leaflet13/leaflet.js"></script>
  <!-- Preparing the page -->
  <style>
   body {
    padding: 0;
    margin: 0;
   }
   html, body, #map {
    height: 100%;
    width: 100vw;
   }
  </style>
  <title>Leaflet on Mobile</title>
 </head>
 <body>
  <div id="map"></div>
  <script>
  // Initializing the map
   var map = L.map('map').fitWorld();
   
   L.tileLayer('https://{s}.tile.openstreetmap.org/{z}/{x}/{y}.png', {
    attribution: 'Map data © <a href="https://www.openstreetmap.org/copyright">OpenStreetMap</a> contributors',
    maxZoom: 18
   }).addTo(map);
   // Geolocation
   map.locate({setView:true, maxZoom: 16});
   function onLocationFound(e) {
    var radius = e.accuracy / 2;
  
    L.marker(e.latlng).addTo(map)
     .bindPopup("You are witin " + radius + " meters from this point").openPopup();
    
    L.circle(e.latlng, radius).addTo(map);
   }
   
   map.on('locationfound', onLocationFound);
   function onLocationError(e) {
    alert(e.message);
    
    map.on('locationerror', onLocationError);
   }
  </script>
 </body>
</html>

2018年4月5日木曜日

Leaflet 1.3 - 4-1 Leaflet Quick Start Guide

4-1 Leaflet Quick Start Guide
A simple step-by-step guide that will quickly get you started with Leaflet basics, including setting up a Leaflet map (with Mapbox tiles) on your page, working with markers, polylines and popups, and dealing with events.

ページに(Mapbox タイルを使用して)Leaflet マップを設定、および、マーカとポリライン、ポップアップを使用した作業、および、イベント処理を含む Leaflet の基本機能を使用してすぐに始められる単純なステップバイステップガイド。

「Leaflet Quick Start Guide(http://leafletjs.com/examples/quick-start/)」に従ってファイルを作成します。

Preparing your page
ページの準備

Before writing any code for the map, you need to do the following preparation steps on your page:

マップのためのコードを書く前に、ページに次の準備段階を実行する必要があります:

● Include Leaflet CSS file in the head section of your document:

(HTML)ドキュメントの head セクションに Leaflet CSS ファイルを挿入します:
<link rel="stylesheet" href="https://unpkg.com/leaflet@1.3.1/dist/leaflet.css"
 integrity="sha512-Rksm5RenBEKSKFjgI3a41vrjkw4EVPlJ3+OiI65vTjIdo9brlAacEuKOiQ5OFh7cOI1bkDwLqdLw3Zg0cRJAAQ=="
 crossorigin=""/>
● Include Leaflet JavaScript file after Leaflet’s CSS:

Leaflet CSS の後に Leaflet JavaScript ファイルを挿入します:
<!-- Make sure you put this AFTER Leaflet's CSS -->
<script src="https://unpkg.com/leaflet@1.3.1/dist/leaflet.js"
 integrity="sha512-/Nsx9X4HebavoBvEBuyp3I7od5tA0UzAxs+j83KgC8PU0kgB4XiK4Lfe4y4cgBtaRJQEIFCW+oC506aPT2L1zw=="
 crossorigin=""></script>
Put a div element with a certain id where you want your map to be:

div エレメントをマップにしたい id とともに設置します:
<div id="mapid"></div>
Make sure the map container has a defined height, for example by setting it in CSS:

例えば、CSS に設定っすることによって、定義された高さがあるマップコンテナを確認します:
#mapid { height: 180px; }
Now you’re ready to initialize the map and do some stuff with it.

今、マップを初期化し、材料を実行する準備ができました。


Setting up the map
マップの設定

Let’s create a map of the center of London with pretty Mapbox Streets tiles. First we’ll initialize the map and set its view to our chosen geographical coordinates and a zoom level:

見事な Mapbox Streets tiles でロンドンの中心部のマップを作成します。最初に、マップを初期化し、選んだ地理座標とズームレベルにビューを設定します:
var mymap = L.map('mapid').setView([51.505, -0.09], 13);
By default (as we didn’t pass any options when creating the map instance), all mouse and touch interactions on the map are enabled, and it has zoom and attribution controls.

初期値によって(マップ事例を作成するときオプションをと適用していないので)、マップの全てのマウスとタッチ作用は利用可能で、ズームと属性コントロール(制御)があります。

Note that setView call also returns the map object — most Leaflet methods act like this when they don’t return an explicit value, which allows convenient jQuery-like method chaining.

setView コールは、同じようにマップオブジェクトを返します - 便利な jQuery 風のメッソッド連鎖を許可するという、はっきりした値を返さないとき殆どの Leaflet メソッドはこのように動作することは、重要です。

Next we’ll add a tile layer to add to our map, in this case it’s a Mapbox Streets tile layer. Creating a tile layer usually involves setting the URL template for the tile images, the attribution text and the maximum zoom level of the layer. In this example we’ll use the mapbox.streets tiles from Mapbox’s “Classic maps” (in order to use tiles from Mapbox, you must also request an access token).

次に、タイルレイヤをマップに追加するために追加します、この場合、それは Mapbox Streets タイルレイヤです。タイルレイヤを作成することは、通常、タイル画像の URL template と属性テキスト(attribution text)、レイヤの最大ズームレベル(maximum zoom level)の設定を含みます。この例では、Mapbox の "Classic maps”(Mapbox からタイルを使用することによって、アクセストークン(access token)もリクエストする必要があります)から mapbox.streets タイルを使用します。
L.tileLayer('https://api.tiles.mapbox.com/v4/{id}/{z}/{x}/{y}.png?access_token={accessToken}', {
 attribution: 'Map data © <a href="http://openstreetmap.org">OpenStreetMap</a> contributors, <a href="http://creativecommons.org/licenses/by-sa/2.0/">CC-BY-SA</a>, Imagery © <a href="http://mapbox.com">Mapbox</a>',
 maxZoom: 18,
 id: 'mapbox.streets',
 accessToken: 'your.mapbox.access.token'
}).addTo(mymap);
Make sure all the code is called after the div and leaflet.js inclusion. That’s it! You have a working Leaflet map now.

div と leaflet.js 挿入の後に、全てのコードが呼び出されることを確認します。それで完了です!今、Leaflet マップが動作します。

It’s worth noting that Leaflet is provider-agnostic, meaning that it doesn’t enforce a particular choice of providers for tiles. You can try replacing mapbox.streets with mapbox.satellite, and see what happens. Also, Leaflet doesn’t even contain a single provider-specific line of code, so you’re free to use other providers if you need to (we’d suggest Mapbox though, it looks beautiful).

Leaflet は、プロバイダ不可知論者(プロバイダの存在について確かな知識を持っていない)、それは、タイルに対して特定のプロバイダを選択することを強制するものではないことを意味します。mapbox.streets を mapbox.satellite に置き換えてみると、何が起こるかわかります。Leaflet は、単一のプロバイダ固有のラインのコードさえ含みません、それは、もし必要なら他のプロバイダを使用することを束縛しません。(美しく見えるので、Mapbox を提案します。)


Mapbox のツール、API、SDK を使用するには、Mapbox access token が必要です。そのためには、Mapbox でアカウントを作成します。
ここでは、アカウントの作成が必要ない OpenStreetMap を使用してみました。コードの例は、Overview ページにあります。
<div id="mapid" style="width: 600px; height: 400px;"></div>
<script>
 L.tileLayer('https://{s}.tile.openstreetmap.org/{z}/{x}/{y}.png', {
  attribution: '© <a href="https://www.openstreetmap.org/copyright">OpenStreetMap</a> contributors',
  maxZoom: 18
 }).addTo(mymap);
</script>


Markers, circles and polygons

Besides tile layers, you can easily add other things to your map, including markers, polylines, polygons, circles, and popups. Let’s add a marker:

タイルレイヤの他にも、マーカやポリライン、ポリゴン、円、ポップアップを含む他のものをマップに簡単に追加できます。マーカを追加してみます。
var marker = L.marker([51.5, -0.09]).addTo(mymap);
Adding a circle is the same (except for specifying the radius in meters as a second argument), but lets you control how it looks by passing options as the last argument when creating the object:

(2番めの引数としてメータ単位で半径を指定する場合を除いて)円を追加することは同じです、しかし、オブジェクトを作成するとき、最後の因数としてオプションを渡すことによって表示方法を制御できます。
var circle = L.circle([51.508, -0.11], {
 color: 'red',
 fillColor: '#f03',
 fillOpacity: 0.5,
 radius: 500
}).addTo(mymap);
Adding a polygon is as easy:

ポリゴンを追加することも簡単です:
var polygon = L.polygon([
 [51.509, -0.08],
 [51.503, -0.06],
 [51.51, -0.047]
]).addTo(mymap);


Working with popups
ポップアップを使用した動作

Popups are usually used when you want to attach some information to a particular object on a map. Leaflet has a very handy shortcut for this:

ポップアップ(popup)は、マップ上の特定のオブジェクトに、いくつかの情報を付属させたいときに、通常、使用されます。Leaflet は、これに対してとても便利なショートカットがあります。
marker.bindPopup("<b>Hello world!</b><br>I am a popup.").openPopup();
circle.bindPopup("I am a circle.");
polygon.bindPopup("I am a polygon.");


Try clicking on our objects. The bindPopup method attaches a popup with the specified HTML content to your marker so the popup appears when you click on the object, and the openPopup method (for markers only) immediately opens the attached popup.

オブジェクトをクリックしてみましょう。bindPopup メソッドはマーカに、指定された HTML コンテンツを伴ったポップアップを付属し、オブジェクトをクリックしたときポップアップが現れます。そして、openPopup メソッドが、(マーカに対してだけ)付属されたポップアップをすぐに開きます。


You can also use popups as layers (when you need something more than attaching a popup to an object):

(オブジェクトにポップアップを付属することよりも何かを必要とするとき)レイヤとしてポップアップも使用できます。
var popup = L.popup()
 .setLatLng([51.5, -0.09])
 .setContent("I am a standalone popup.")
 .openOn(mymap);
Here we use openOn instead of addTo because it handles automatic closing of a previously opened popup when opening a new one which is good for usability.

ここで、addTo の代わりに openOn を使用します。なぜなら、使い勝手がいいように、新しいポップアップが開いたときその前に開いたポップアップを自動的に閉じる処理をします。


Dealing with events
イベントの処理

Every time something happens in Leaflet, e.g. user clicks on a marker or map zoom changes, the corresponding object sends an event which you can subscribe to with a function. It allows you to react to user interaction:

Leaflet で発生することはいつでも、マーカをクリックしたり、マップのズームが変わるなど、corresponding オブジェクトは、ファンクションで登録されたイベントを送信します。それは、ユーザとのインタラクション(対話)に反応することを許可します:
function onMapClick(e) {
 alert("You clicked the map at " + e.latlng);
}

mymap.on('click', onMapClick);

Each object has its own set of events — see documentation for details. The first argument of the listener function is an event object — it contains useful information about the event that happened. For example, map click event object (e in the example above) has latlng property which is a location at which the click occured.

各オブジェクトは、それ自身のイベントの設定があります - 詳細はドキュメントを参照してください。listener ファンクションの1番目の引数は、event オブジェクトです - それは発生するイベントについて有用な情報を含んでいます。例えば、map click event オブジェクト(上記 example の e)は、クリック発生位置である経緯度プロパティを持っています。

Let’s improve our example by using a popup instead of an alert:

alert(アラート)の代わりに popup(ポップアップ)を使用することによって example を改良します。
var popup = L.popup();

function onMapClick(e) {
 popup
  .setLatLng(e.latlng)
  .setContent("You clicked the map at " + e.latlng.toString())
  .openOn(mymap);
}

mymap.on('click', onMapClick);
Try clicking on the map and you will see the coordinates in a popup. View the full example →

マップ状をクリックしてポップアップの地理座標を見てみます。全ての機能の例を見ます ->


Now you’ve learned Leaflet basics and can start building map apps straight away! Don’t forget to take a look at the detailed documentation or other examples.

これで Leaflet の基礎を習得しすぐにマップアプリを構築し始めることができます。詳細なドキュメント、または、他の例を確認することを忘れないでください。

全コード
<!DOCTYPE html>
<html>
 <head>
  <meta charset="UTF-8">
  <link rel="stylesheet" href="https://unpkg.com/leaflet@1.3.1/dist/leaflet.css"
   integrity="sha512-...(省略)"
   crossorigin=""/>
  <!-- Make sure you put this AFTER Leaflet's CSS -->
  <script src="https://unpkg.com/leaflet@1.3.1/dist/leaflet.js"
   integrity="sha512-...(省略)"
   crossorigin=""></script>
  <title>Leaflet Quick Start Guide</title>
 </head>
 <body>
  <div id="mapid" style="width: 600px; height: 400px;"></div>
  <script>
   // Setting up the map
   var mymap = L.map('mapid').setView([51.505, -0.09], 13);
// L.tileLayer('https://api.tiles.mapbox.com/v4/{id}/{z}/{x}/{y}.png?access_token={accessToken}', {
   L.tileLayer('https://{s}.tile.openstreetmap.org/{z}/{x}/{y}.png', {
    attribution: '&copy; <a href="https://www.openstreetmap.org/copyright">OpenStreetMap</a> contributors',
    maxZoom: 18 //,
//  id: 'mapbox.streets',
//  accessToken: 'your.mapbox.access.token'
   }).addTo(mymap);
   // Markers, circles and polygons
   var marker = L.marker([51.5, -0.09]).addTo(mymap);
   
   var circle = L.circle([51.508, -0.11], {
    color: 'red',
    fillColor: '#f03',
    fillOpacity: 0.5,
    radius: 500
   }).addTo(mymap);
   
   var polygon = L.polygon([
    [51.509, -0.08],
    [51.503, -0.06],
    [51.51, -0.047]
   ]).addTo(mymap);
   // Working with popups
   marker.bindPopup("<b>Hello world!</b><br>I am a popup.").openPopup();
   circle.bindPopup("I am a circle.");
   polygon.bindPopup("I am a polygon.");
   // Working with popups
   var popup = L.popup()
    .setLatLng([51.5, -0.09])
    .setContent("I am a standalone popup.")
    .openOn(mymap);
   // Dealing with events
   /**
   function onMapClick(e) {
    alert("You clicked the map at " + e.latlng);
   }

   mymap.on('click', onMapClick);
   */
   function onMapClick(e) {
    popup
     .setLatLng(e.latlng)
     .setContent("You clicked the map at " + e.latlng.toString())
     .openOn(mymap);
   }

   mymap.on('click', onMapClick);
  </script>
 </body>
</html>

Leaflet 1.3 - 4 Tutorials

4 Tutorials
「Leaflet Tutorials(http://leafletjs.com/examples.html)」の例を試してみます。
「Leaflet Tutorials」に次のようにあります。

Every tutorial here comes with step-by-step code explanation and is easy enough even for beginner JavaScript developers.

ここのどのチュートリアルも、ステップバイステップのコード説明からなっており、初心者の JavaScript 開発者にも十分わかりやすくなっています。


HTML ファイルの作成
a eclipse を起動します。

b 「leafletproj」の「WebContent」をクリックして選択します。


c メニューの「ファイル」->「新規」->「HTMLファイル」をクリックします。


d 「新規HTMLファイル」ウィンドウの「HTMLファイル」で「ファイル名」を「1-quickstart.html」と入力し、「次へ」ボタンをクリックします。


e 「新規HTMLファイル」ウィンドウの「HTMLテンプレートの選択」で「テンプレート」を「新規HTMLファイル(5)」を選択し、「完了」ボタンをクリックします。


Leaflet 1.3 - 3 準備

3 準備
3-1 ダウンロード

1 Download Leaflet
http://leafletjs.com/
Download - Leaflet — a JavaScript library for interactive maps

の「Download Leaflet」の「Version」が「Leaflet 1.3.1」をクリックします。
次のように表示されたら「OK」をクリックします。


2 ダウンロードしたファイルを展開します。
user@deb9-vmw:~$ cd ダウンロード
user@deb9-vmw:~/ダウンロード$ ls
---
leaflet.zip
---
user@deb9-vmw:~/ダウンロード$ unzip -d leaflet13 leaflet.zip
user@deb9-vmw:~/ダウンロード$ ls
---
leaflet.zip
leaflet13
---

3-2 Eclipse プロジェクトの作成
1 Eclipse を起動します。

user@deb9-vmw:~/ダウンロード$ cd
user@deb9-vmw:~$ eclipse

起動の途中で「ワークスペースの選択」ウィンドウが表示されます。
「参照」ボタンをクリックして /home/user/public_html/eclipse-workspace でとりあえず「OK」をクリックします。


2 メイン・メニューで「ファイル」→「新規」→「プロジェクト」(または「新規」ボタン→「プロジェクト」)を選択して新規プロジェクト・ウィザードを開きます。


3 「新規プロジェクト」ウィンドウで「ウィザード(W)」の「Web」左側の▼をクリックし、一覧の「静的 Web プロジェクト」をクリックして選択し、「次」をクリックします。


4 「新規静的 Web プロジェクト」で「プロジェクト名」に「leafletproj」と入力します。「プロジェクトの場所」は、/home/user/public_html/eclipse-workspace にしています。
「次>」ボタンをクリックします。


5 「静的 Web モジュール設定を構成します。」はこのままで「完了」ボタンをクリックします。


6 「関連付けられたパースペクティブを開きますか?」ウィンドウで「パースペクティブを開く」ボタンをクリックします。


3-3 Eclipse にインポート
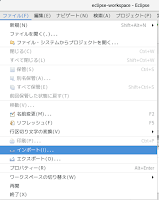
1 メニューの ファイル -> インポート をクリックします。


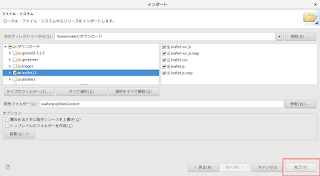
2 「インポート」ダイアログの「選択」の「インポート・ウィザードの選択(S):」で、一般 -> ファイル・システム をクリックして選択し、「次へ」ボタンをクリックします。


3 「インポート」ダイアログの「ファイル・システム」の「次のディレクトリから(Y):」欄の右側の「参照(R)」ボタンをクリックします。


4 「ディレクトリーからインポート」ダイアログで左側の「ホーム」をクリックして、表示された「名前」欄の「ダウンロード」をクリックして選択し、「OK」ボタンをクリックします。


5 「インポート」ダイアログの「ファイル・システム」の「ダウンロード」の左側の三角形(▼)をクリックして「ダウンロード」以下の一覧を表示し、「leaflet13」をクリックして選択します。


6 「インポート」ダイアログの「ファイル・システム」の「宛先フォルダー(L):」欄の右側の「参照(W)」ボタンをクリックします。


7 「フォルダーにインポート」ダイアログで「leafletproj -> WebComtent」をクリックして選択し、「OK」ボタンをクリックします。


8 「インポート」ダイアログの「ファイル・システム」の「完了(F)」ボタンをクリックします。


9 検証(時間がかかることがあります)が終わったあと「プロジェクタ・エクスプローラー」ビューの「leafletproj」左側の▽をクリックして、「WebContent/leaflet13」を表示します。


10 「leaflet13」左側の▽をクリックすると中身が表示されます。


Leaflet 1.3 - 2 ダウンロード

2 ダウンロード

Download Leaflet
http://leafletjs.com/
Download - Leaflet — a JavaScript library for interactive maps

に、次のように書かれています。

VersionDescription
Leaflet 1.3.1Stable version, released on January 18, 2018.
Leaflet 1.3-devIn-progress version, developed on the master branch.
Leaflet 0.7.7Legacy version, released on November 18, 2013 and last updated on October 26, 2015.


Note that the master version can contain incompatible changes, so please read the changelog carefully when upgrading to it.

マスタバージョンは、互換できない変更が含まれているので、アップグレードするときはチェンジログを注意して読んでください。


Using a Hosted Version of Leaflet

The latest stable Leaflet release is available on several CDN’s — to start using it straight away, place this in the head of your HTML code:

最新の安定版 Leaflet は、いくつかの CDN 上のものを利用できます。- 直接、使用し始めるためには、HTML コードの冒頭にこれを設置します。
<link rel="stylesheet" href="https://unpkg.com/leaflet@1.3.1/dist/leaflet.css" />
<script src="https://unpkg.com/leaflet@1.3.1/dist/leaflet.js"<>/script>

To avoid potential security problems, we recommend and encourage enabling subresource integrity when using Leaflet from a CDN:

含まれているセキュリティ問題を避けるために、Leaflet を CDN から使用するとき、 subresource integrity を可能にすることを推奨し(強く望み)ます。

Subresource Integrity
Subresource Integrity - Web セキュリティ | MDN
https://developer.mozilla.org/ja/docs/Web/Security/Subresource_Integrity
<link rel="stylesheet" href="https://unpkg.com/leaflet@1.3.1/dist/leaflet.css"
  integrity="sha512-Rksm5RenBEKSKFjgI3a41vrjkw4EVPlJ3+OiI65vTjIdo9brlAacEuKOiQ5OFh7cOI1bkDwLqdLw3Zg0cRJAAQ=="
  crossorigin=""/>
<script src="https://unpkg.com/leaflet@1.3.1/dist/leaflet.js"
  integrity="sha512-/Nsx9X4HebavoBvEBuyp3I7od5tA0UzAxs+j83KgC8PU0kgB4XiK4Lfe4y4cgBtaRJQEIFCW+oC506aPT2L1zw=="
  crossorigin=""<>/script>

訳注 Subresource Integrity については、MDN web docs の「Subresource Integrity(https://developer.mozilla.org/ja/docs/Web/Security/Subresource_Integrity)」などを参照してください。


Leaflet is available on the following free CDN’s: unpkg, cdnjs, jsDelivr

Leaflet は、次のフリー CDN: unpkg、cdnjs、jsDelivr が便利です。

Disclaimer: these services are external to Leaflet; for questions or support, please contact them directly.

免責事項: これらのサービスは、Leaflet の外部サイトです。問い合わせやサポートは、そちらに、直接、コンタクトしてください。


Using a Downloaded Version of Leaflet

Inside the archives downloaded from the above links, you will see four things:

上記リンクからダウンロードされるアーカイブ内は、4つのものがあります。

● leaflet.js - This is the minified Leaflet JavaScript code.
● leaflet-src.js - This is the readable, unminified Leaflet JavaScript, which is sometimes helpful for debugging. (The integrity hash for this file is sha512-IkGU/uDhB9u9F8k+2OsA6XXoowIhOuQL1NTgNZHY1nkURnqEGlDZq3GsfmdJdKFe1k1zOc6YU2K7qY+hF9AodA==)
● leaflet.css - This is the stylesheet for Leaflet.
● images - This is a folder that contains images referenced by leaflet.css. It must be in the same directory as leaflet.css.

● leaflet.js - これは、縮小版 Leaflet JavaScript コードです。
● leaflet-src.js - これは、読み取れる、縮小されていない Leaflet JavaScript で、デバッグに役立つこともあります。(このファイルの整合性ハッシュは、sha512-IkGU/uDhB9u9F8k+2OsA6XXoowIhOuQL1NTgNZHY1nkURnqEGlDZq3GsfmdJdKFe1k1zOc6YU2K7qY+hF9AodA== です。)
● leaflet.css - これは、Leaflet のスタイルシートです。
● images - これは、leaflet.css が参照する画像が含まれているフォルダです。leaflet.css と同じディレクトリになければなりません。

Unzip the downloaded archive to your website’s directory and add this to the head of your HTML code:

ダウンロードされたアーカイブをウェブディレクトリで unzip を実行(解凍)し、次のように HTNL コードの冒頭に追加します。
<link rel="stylesheet" href="/path/to/leaflet.css" />
<script src="/path/to/leaflet.js"></script>

Using a JavaScript package manager

If you use the npm package manager, you can fetch a local copy of Leaflet by running:

npm パッケージマネージャを使用する場合、次のように実行して Leaflet のローカルコピーを取ってくることができます。

npm install leaflet

You will find a copy of the Leaflet release files in node_modules/leaflet/dist.

node_modules/leaflet/dist に Leaflet リリースファイルのコピーを見つけられます。


Leaflet Source Code

These download packages above only contain the library itself. If you want to download the full source code, including unit tests, files for debugging, build scripts, etc., you can download it from the GitHub repository.

上記のこれらのダウンロードパッケージは、ライブラリ自身があるだけです。ユニットテストやデバッグのためのファイル、ビルドスクリプトなど、全てのソースコードをダウンロードしたい場合は、GitHub リポジトリからダウンロードできます。


Building Leaflet from the Source

Leaflet build system is powered by the Node.js platform, which installs easily and works well across all major platforms. Here are the steps to set it up:

Leaflet ビルドシステムは、Node.js プラットフォームによって動作しているので、全ての主要なプラットフォームに渡ってかんたんにインストールでき、良好に動作します。
このステップでセットアップします:

1. Download and install Node
2. Run the following command in the command line:

1. Node をダウンロードし、インストールします
2. コマンドラインで次のコマンドを実行します

npm install

Now that you have everything installed, run npm run build inside the Leaflet directory. This will combine and compress the Leaflet source files, saving the build to the dist folder.

Leaflet ディレクトリにインストールされているすべてのものがあり、npm を実行し、build を実行します。これは、Leaflet ソースファイルを結合して圧縮し、build を dist フォルダに保存します。

Leaflet 1.3 - 1 はじめに

1 はじめに

Leaflet — an open-source JavaScript library
for mobile-friendly interactive maps
http://leafletjs.com/
Leaflet — a JavaScript library for interactive maps

に、次のように書かれています。


Leaflet is the leading open-source JavaScript library for mobile-friendly interactive maps. Weighing just about 38 KB of JS [38KB gzipped - that's 133KB minified and 378KB in the source form, with 10KB of CSS (2 KB gzipped) and 11 KB of mages.], it has all the mapping features most developers ever need.

Leaflet は、モバイルに適したインタラクティブ(対話型)マップのための先進的なオープンソース JavaScript ライブラリです。およそ 38Kバイトほどのファイルサイズで、ほとんどの開発者が常に必要とする全てのマッピング機能を備えています。(38KB gzip 圧縮されています - 133KB 圧縮版とソースフォームに 378KB、10KB の CSS (2KB に gzip 圧縮)と 11KB の mage)

Leaflet is designed with simplicity, performance and usability in mind. It works efficiently across all major desktop and mobile platforms, can be extended with lots of plugins, has a beautiful, easy to use and well-documented API and a simple, readable source code that is a joy to contribute to.

Leaflet は、シンプル(簡潔性)、パフォーマンス(性能)、ユーザビリティ(操作性)を考慮して設計されています。全ての主要なデスクトップとモバイルプラットフォームに渡って効果的に動作し、たくさんのプラグインで拡張され、美しく、使いやすく、そして、整備された API と貢献が喜びである簡潔で読みやすいソースコードです。

Here we create a map in the 'map' div, add tiles of our choice, and then add a marker with some text in a popup:

ここに、'map' div にマップを作成し、選択したタイルを追加し、ポップアップにいくつかのテキストがあるマーカを追加します:

var map = L.map('map').setView([51.505, -0.09], 13);

L.tileLayer('http://{s}.tile.osm.org/{z}/{x}/{y}.png', {
 attribution: '© OpenStreetMap contributors'
}).addTo(map);

L.marker([51.5, -0.09]).addTo(map)
 .bindPopup('A pretty CSS3 popup.
 Easily customizable.')
 .openPopup();

Learn more with the quick start guide, check out other tutorials, or head straight to the API documentation. If you have any questions, take a look at the FAQ first.

quick start guide で更に学習し、他のチュートリアルを確認し、または、API ドキュメントに直接に向かっ(参照し)てください。疑問があれば、最初に、FAQ を参照してください。


「Features」には、次のように説明があります。

Features

Leaflet doesn't try to do everything for everyone. Instead it focuses on making the basic things work perfectly.

Leaflet は、すべての人のためにすべてのことを試していません。そのかわりに、基本的なものを完全に動作させることに焦点を合わせています。

Layers Out of the Box
 Tile layers, WMS
 Markers, Popups
 Vector layers: polylines, polygons, circles, rectangles
 Image overlays
 GeoJSON

Interaction Features
 Drag panning with inertia
 Scroll wheel zoom
 Pinch-zoom on mobile
 Double click zoom
 Zoom to area (shift-drag)
 Keyboard navigation
 Events: click, mouseover, etc.
 Marker dragging

Visual Features
 Zoom and pan animation
 Tile and popup fade animation
 Very nice default design for markers, popups and map controls
 Retina resolution support

Customization Features
 Pure CSS3 popups and controls for easy restyling
 Image- and HTML-based markers
 A simple interface for custom map layers and controls
 Custom map projections (with EPSG:3857/4326/3395 out of the box)
 Powerful OOP facilities for extending existing classes

Performance Features
 Hardware acceleration on mobile makes it feel as smooth as native apps
 Utilizing CSS3 features to make panning and zooming really smooth
 Smart polyline/polygon rendering with dynamic clipping and simplification makes it very fast
 Modular build system for leaving out features you don't need
 Tap delay elimination on mobile

Map Controls
 Zoom buttons
 Attribution
 Layer switcher
 Scale

Browser Support
Desktop
 Chrome
 Firefox
 Safari 5+
 Opera 12+
 IE 7–11

Mobile
 Safari for iOS 7+
 Android browser 2.2+, 3.1+, 4+
 Chrome for mobile
 Firefox for mobile
 IE10+ for Win8 devices

Misc
 Extremely lightweight
 No external dependencies

If you find some feature really missing in Leaflet, first check if there's a plugin for it. If not, please vote for the feature on the Leaflet UserVoice page.

Leaflet に全くない機能を探すときは、最初に、そのプラグインがあるか確認してください。もしなければ、Leaflet UserVoice ページに機能を投票してください。


「Getting Involved」には、次のように説明があります。

Getting Involved

Let's create the best mapping library that will ever exist! Leaflet is developed by Vladimir Agafonkin of Mapbox with a team of dedicated contributors. Pull requests are always welcome. However, there are many more ways to get involved with the development of Leaflet.

すでに存在している最高のマッピングライブラリを作成しましょう!Leaflet は、献身的な機構者とともに Mapbox の Vladimir Agafonkin によって開発されています。プルリクエストはいつでも歓迎されています。しかしながら、Leaflet の開発に関わるさらに多くの方法がります。

You can help the project tremendously by discovering and reporting bugs, improving documentation, helping others on Stack Overflow, GIS Stack Exchange and GitHub issues, showing your support for your favorite feature suggestions on Leaflet UserVoice page, tweeting to @LeafletJS and spreading the word about Leaflet among your colleagues and friends.

バグの発見と報告(Reporting Bugs)、および、ドキュメントの向上(Improving Documentation)、および、Stack Overflow と GIS Stack Exchange と GitHub issues の他の支援、および、Leaflet UserVoice page のお気に入り機能提案の支援の参照、および、@LeafletJS へのツイート、および、同僚や友人へ Leaflet についての言葉の普及によってプロジェクトをとても支援できます。

Check out the contribution guide for more information on getting involved with Leaflet development.

Leaflet の開発に関わるさらに多くのインフォメーションのコントリビューション(支援)ガイドを確認してください。