ラベル GeoJSON の投稿を表示しています。 すべての投稿を表示

2018年9月26日水曜日

OpenLayers5 Workshop - 2.1 Rendering GeoJSON

2 Vector Data

Let's make a feature editor!

In this module, we'll create a basic editor for working with vector data. Our goal is to make it so a user can import data, draw new features, modify existing features, and export the result. We'll be working with GeoJSON data in this module, but OpenLayers supports a broad range of vector formats if you're interested in working with other sources.

このモジュールでは、ベクタデータを使って動作するための基本エディタを作成します。データをインポートし、新しいフィーチャを描き、現在あるフィーチャを変形し、結果をエクスポートします。このモジュールでは GeoJSON データで演習しますが、他のソースで演習することに興味があるなら、OpenLayers は広い範囲のベクタフォーマットをサポートします。

● Rendering GeoJSON
● Drag and drop
● Modifying features
● Drawing new features
● Snapping
● Downloading features
● Making it look nice

● GeoJSON を描画
● ドラッグ・アンド・ドロップ
● フィーチャを変形
● 新しいフィーチャを描画
● スナップ
● フィーチャをダウンロード
● 見栄えを良くする


2.1 Rendering GeoJSON
GeoJSON を描画

Before getting into editing, we'll take a look at basic feature rendering with a vector source and layer. The workshop includes a countries.json GeoJSON file in the data directory. We'll start by just loading that data up and rendering it on a map.

編集に入る前に、ベクタソースとレイヤで描画する基本フィーチャをみてみます。ワークショップはデータディレクトリの countries.json GeoJSON ファイルを含みます。そのデータを読み込み、マップにそれを描画するだけで初めます。

First, edit your index.html so we're ready to render a full page map:

最初に、(ページ全体に表示する)フルページマップを描画を準備するために、index.html を編集します:
<!DOCTYPE html>
<html>
 <head>
  <meta charset="utf-8">
  <title>OpenLayers</title>
  <style>
   html, body, #map-container {
    margin: 0;
    height: 100%;
    width: 100%;
    font-family: sans-serif;
    background-color: #04041b;
   }
  </style>
 </head>
 <body>
  <div id="map-container"></div>
 </body>
</html>
Now we'll import the three important ingredients for working with vector data:

次に、ベクタデータで動作するために3つの重要な構成要素をインポートします:

● a format for reading and writing serialized data (GeoJSON in this case)
● a vector source for fetching the data and managing a spatial index of features
● a vector layer for rendering the features on the map

● シリアル化されたデータを読み書きするフォーマット(このケースの GeoJSON)
● データを取ってきてフィーチャの空間インデックスを管理するベクタソース
● マップ上にフィーチャを描画するベクタレイヤ

Update your main.js to load and render a local file containing GeoJSON features:

GeoJSON フィーチャを含む(サーバ内の)ローカルファイルをロードし描画するため main.js を更新します:
import 'ol/ol.css';
import GeoJSON from 'ol/format/GeoJSON';
import Map from 'ol/Map';
import VectorLayer from 'ol/layer/Vector';
import VectorSource from 'ol/source/Vector';
import View from 'ol/View';
new Map({
 target: 'map-container',
 layers: [
  new VectorLayer({
   source: new VectorSource({
    format: new GeoJSON(),
    url: './data/countries.json'
   })
  })
 ],
 view: new View({
  center: [0, 0],
  zoom: 2
 })
});
You should now be able to see a map with country borders at http://localhost:3000/.

http://localhost:3000/ で国境があるマップを見ることができます。

GeoJSON features

Since we'll be reloading the page a lot, it would be nice if the map stayed where we left it in a reload. We can bring in the ol-hashed package to make this work. Normally we'd install it first (though it should be included with the workshop dependencies already):

ページをよくリロードするので、マップがリロードで残ったた状態なら良いことです。これを動作させるために ol-hashed パッケージを取り入れることができます。(それはすでにワークショップの依存関係と一緒に含まれているので)通常、最初にそれをインストールします:

npm install ol-hashed@beta

Then in our main.js we'll import the function exported by the package:

それから main.js にパッケージによってエクスポートされたファンクションをインポートします:

import sync from 'ol-hashed';

And now we can call this function with our map:

それから、map でこのファンクションを呼び出します:

sync(map);

Now you should see that page reloads keep the map view stable. And the back button works as you might expect.

これで、ページがマップビューを変動のないままリロードすることがわかります。そして、戻るボタンは期待するように動作します。

■□ Debian9 で試します■□
countries.json のデータの場所を確認します。

user@deb9-vmw:~/openlayers-workshop-en$ ls data
---
countries.json
---

前回使用した index.html のバックアップを保存して次のように修正します。

user@deb9-vmw:~/openlayers-workshop-en$ cp index.html index.html_basic
user@deb9-vmw:~/openlayers-workshop-en$ vim index.html
<!DOCTYPE html>
<html>
 <head>
  <meta charset="utf-8">
  <title>OpenLayers</title>
  <style>
   html, body, #map-container {
    margin: 0;
    height: 100%;
    width: 100%;
    font-family: sans-serif;
    background-color: #04041b;
   }
  </style>
 </head>
 <body>
  <div id="map-container"></div>
 </body>
</html>
前回使用した main.js のバックアップを保存して次のように修正します。

user@deb9-vmw:~/openlayers-workshop-en$ cp main.js main.js_basic
user@deb9-vmw:~/openlayers-workshop-en$ vim main.js
import 'ol/ol.css'; 
import GeoJSON from 'ol/format/GeoJSON';
import Map from 'ol/Map'; 
import VectorLayer from 'ol/layer/Vector'; 
import VectorSource from 'ol/source/Vector'; 
import View from 'ol/View'; 
new Map({
 target: 'map-container',
 layers: [
  new VectorLayer({
   source: new VectorSource({
    format: new GeoJSON(),
    url: './data/countries.json'
   })
  })
 ], 
 view: new View({
  center: [0, 0],
  zoom: 2
 })
}); 
http://localhost:3000/ とブラウザでマップを開きます。(もし開かなければ、'npm start' を実行してください。


ol-hashed package をインストールします。

user@deb9-vmw:~/openlayers-workshop-en$ npm install ol-hashed
> ol-workshop@0.0.0 start /home/nob61/openlayers-workshop-en
> webpack-dev-server --mode=development

ℹ 「wds」: Project is running at http://localhost:3000/
ℹ 「wds」: webpack output is served from /
ℹ 「wdm」: 
ℹ 「wdm」: Compiled successfully.
^Cnob61@deb9-vmw:~/openlayers-workshop-en$ npm install ol-hashed
npm WARN extract-text-webpack-plugin@3.0.2 requires a peer of webpack@^3.1.0 but none is installed. You must install peer dependencies yourself.

+ ol-hashed@2.0.0-beta.2
updated 2 packages and audited 7519 packages in 11.534s
found 0 vulnerabilities
main.js 次のように修正します。

user@deb9-vmw:~/openlayers-workshop-en$ cp main.js main.js_basic
user@deb9-vmw:~/openlayers-workshop-en$ vim main.js
import 'ol/ol.css'; 
import GeoJSON from 'ol/format/GeoJSON';
import Map from 'ol/Map'; 
import VectorLayer from 'ol/layer/Vector'; 
import VectorSource from 'ol/source/Vector'; 
import View from 'ol/View'; 
import sync from 'ol-hashed';
new Map({
 target: 'map-container',
 layers: [
  new VectorLayer({
   source: new VectorSource({
    format: new GeoJSON(),
    url: './data/countries.json'
   })
  })
 ], 
 view: new View({
  center: [0, 0],
  zoom: 2
 })
}); 
sync(map);
今回は、地図を拡大したり中心を移動して再読込やブラウザの「戻る」ボタンを押すと 'sync(map);' を設定する前と動作がかわりませんでした。
■□ここまで■□

2014年11月30日日曜日

2 - ol3ex 26b - GeoJSON example 2

「geojson.js(226-ol3ex.js)」は、マップを表示するための JavaScript ファイルです。
「The GeoJSON Format Specification(geojson.org/geojson-spec.html)」の「1. Introduction」に次のようにあります。

*****
GeoJSON is a format for encoding a variety of geographic data structures.
GeoJSON は、様々な地理的データ構造を符号化するためのフォーマットです。

A GeoJSON object may represent a geometry, a feature, or a collection of features.
GeoJSONオブジェクトは、ジオメトリ、フィーチャ、またはフィーチャのコレクションを表すことができます。

GeoJSON supports the following geometry types: Point, LineString, Polygon, MultiPoint, MultiLineString, MultiPolygon, and GeometryCollection.
GeoJSONは、以下のジオメトリ·タイプをサポートしています:ポイント、ラインストリング、ポリゴン、マルチポイント、マルチストリング、マルチポリゴン、ジオメトリコレクションです。

Features in GeoJSON contain a geometry object and additional properties, and a feature collection represents a list of features.
GeoJSONにおけるフィーチャは、ジオメトリオブジェクトと追加のプロパティが含まれており、フィーチャコレクションはフィーチャのリストを表します。
*****

「226-ol3ex.js」
var image = new ol.style.Circle({
/** ol.style.Circle
 * Set circle style for vector features.
 * ベクタフィーチャの円のスタイルを設定。(ol3 API)
 */
 radius: 5,
 fill: null,
 stroke: new ol.style.Stroke({color: 'red', width: 1})
 /** ol.style.Stroke 
  * Set stroke style for vector features. 
  * Note that the defaults given are the Canvas defaults, 
  * which will be used if option is not defined. 
  * The get functions return whatever was entered 
  * in the options;  they will not return the default.
  * ベクタフィーチャのためのストロークスタイルの設定。
  * デフォルトは、オプションが定義されていない場合に使用される
  * Canvas のデフォルトを与えられることに注意してください。 
  * GET機能は、オプションで入力されたものはすべて返します。
  * それらはデフォルトを返しません。(ol3 API)
  */
});
var styles = {
 'Point': [new ol.style.Style({
 /** ol.style.Style 
  * Base class for vector feature rendering styles.
  * ベクタフィーチャがスタイルを描画するための基本クラス。
  * (ol3 API)
  */
  image: image
 })],
 'LineString': [new ol.style.Style({
  stroke: new ol.style.Stroke({
   color: 'green',
   width: 1
  })
 })],
 'MultiLineString': [new ol.style.Style({
  stroke: new ol.style.Stroke({
   color: 'green',
   width: 1
  })
 })],
 'MultiPoint': [new ol.style.Style({
  image: image
 })],
 'MultiPolygon': [new ol.style.Style({
  stroke: new ol.style.Stroke({
   color: 'yellow',
   width: 1
  }),
  fill: new ol.style.Fill({
  /** ol.style.Fill 
   * Set fill style for vector features.
   * ベクタフィーチャの塗りつぶしスタイルを設定。(ol3 API)
   */
   color: 'rgba(255, 255, 0, 0.1)'
  })
 })],
 'Polygon': [new ol.style.Style({
  stroke: new ol.style.Stroke({
   color: 'blue',
   lineDash: [4],
   width: 3
  }),
  fill: new ol.style.Fill({
   color: 'rgba(0, 0, 255, 0.1)'
  })
 })],
 'GeometryCollection': [new ol.style.Style({
  stroke: new ol.style.Stroke({
   color: 'magenta',
   width: 2
  }),
  fill: new ol.style.Fill({
   color: 'magenta'
  }),
  image: new ol.style.Circle({
   radius: 10,
   fill: null,
   stroke: new ol.style.Stroke({
    color: 'magenta'
   })
  })
 })],
 'Circle': [new ol.style.Style({
  stroke: new ol.style.Stroke({
   color: 'red',
   width: 2
  }),
  fill: new ol.style.Fill({
   color: 'rgba(255,0,0,0.2)'
  })
 })]
};
var styleFunction = function(feature, resolution) {
 return styles[feature.getGeometry().getType()];
 /** getGeometry()
  * Returns the Geometry associated with this feature 
  * using the current geometry name property. 
  * By default, this is geometry but it may be changed 
  * by calling setGeometryName.
  * 現在の geometry name プロパティを使用して、
  * このフィーチャに関連したジオメトリを返します。
  * デフォルトでは、ジオメトリですが、setGeometryName を
  * 呼び出すことによって変更することができます。(ol3 API)
  */
 /** getType()
  * Get the type of this geometry. 
  * ジオメトリの型を取得。(ol3 API)
  */
};
var vectorSource = new ol.source.GeoJSON(
/** ol.source.GeoJSON 
 * Static vector source in GeoJSON format
 * GeoJSON フォーマットの静的ベクタソース。(ol3 API)
 */
 /** @type {olx.source.GeoJSONOptions} */ ({
 /** @type 
  * 値のタイプ(型)の説明 - 式などで表示
  * ol.source.GeoJSON の値の型は、
  * olx.source.GeoJSONOptions の型を使用。
  * (@use JSDoc[http://usejsdoc.org/]より)
  */
 object: {
  'type': 'FeatureCollection',
  'crs': {
   'type': 'name',
   'properties': {
    'name': 'EPSG:3857'
   }
  },
   'features': [
   {
    'type': 'Feature',
    'geometry': {
     'type': 'Point',
     'coordinates': [0, 0]
    }
   },
   {
    'type': 'Feature',
    'geometry': {
     'type': 'LineString',
     'coordinates': [[4e6, -2e6], [8e6, 2e6]]
    }
   },
   {
    'type': 'Feature',
    'geometry': {
     'type': 'LineString',
     'coordinates': [[4e6, 2e6], [8e6, -2e6]]
    }
   },
   {
    'type': 'Feature',
    'geometry': {
     'type': 'Polygon',
     'coordinates': [[[-5e6, -1e6], [-4e6, 1e6], [-3e6, -1e6]]]
    }
   },
   {
    'type': 'Feature',
    'geometry': {
     'type': 'MultiLineString',
     'coordinates': [
      [[-1e6, -7.5e5], [-1e6, 7.5e5]],
      [[1e6, -7.5e5], [1e6, 7.5e5]],
      [[-7.5e5, -1e6], [7.5e5, -1e6]],
      [[-7.5e5, 1e6], [7.5e5, 1e6]]
     ]
    }
   },
   {
    'type': 'Feature',
    'geometry': {
     'type': 'MultiPolygon',
     'coordinates': [
      [[[-5e6, 6e6], [-5e6, 8e6], [-3e6, 8e6], [-3e6, 6e6]]],
      [[[-2e6, 6e6], [-2e6, 8e6], [0, 8e6], [0, 6e6]]],
      [[[1e6, 6e6], [1e6, 8e6], [3e6, 8e6], [3e6, 6e6]]]
     ]
    }
   },
   {
   'type': 'Feature',
    'geometry': {
     'type': 'GeometryCollection',
     'geometries': [
      {
       'type': 'LineString',
       'coordinates': [[-5e6, -5e6], [0, -5e6]]
      },
      {
       'type': 'Point',
       'coordinates': [4e6, -5e6]
      },
      {
       'type': 'Polygon',
       'coordinates': [[[1e6, -6e6], [2e6, -4e6], [3e6, -6e6]]]
      }
     ]
    }
   }
  ]
 }
}));
vectorSource.addFeature(new ol.Feature(new ol.geom.Circle([5e6, 7e6], 1e6)));
/** addFeature(feature)
 * Add a single feature to the source. If you want 
 * to add a batch of features at once, call 
 * source.addFeatures() instead.
 * ソースに一つのフィーチャを追加します。すぐにフィーチャの
 * バッチを追加したい場合は、代わりに source.addFeatures()
 * を呼び出します。(ol3 API)
 */
/** ol.Feature
 * A vector object for geographic features with a geometry 
 * and other attribute properties, similar to the features 
 * in vector file formats like GeoJSON.
 * GeoJSONのようなベクトルファイル形式のフィーチャに類似した、ジ
 * オメトリとその他の属性プロパティを持つ地物フィーチャのための
 * ベクトルオブジェクト。(ol3 API)
 */
/** ol.geom.Circle 
 * Circle geometry. 円のジオメトリ。(ol3 API)
 */
var vectorLayer = new ol.layer.Vector({
/** ol.layer.Vector
 * Vector data that is rendered client-side.
 * クライアント側で描画されたベクタデータ。(ol3 API)
 */
 source: vectorSource,
 style: styleFunction
});
var map = new ol.Map({
 layers: [
  new ol.layer.Tile({
  /** ol.layer.Tile 
   * For layer sources that provide pre-rendered, tiled 
   * images in grids that are organized by zoom levels for 
   * specific resolutions. 
   * プリレンダリング(事前描画)を提供するレイヤソースのための、
   * 特定の解像度でのズームレベルによって編成されているグリッドの
   * タイルイメージ。(ol3 API)
   */
   source: new ol.source.OSM()
   /** ol.source.OSM 
    * Layer source for the OpenStreetMap tile server.
    * OpenStreetMap タイルサーバのレイヤソース。(ol3 API)
    */
  }),
  vectorLayer
 ],
 target: 'map',
 controls: ol.control.defaults({
 /** controls
  * Controls initially added to the map. 
  * If not specified, ol.control.defaults() is used.
  * 初期設定で、マップに追加されたコントロール。
  * 明示されていなければ、ol.control.defaults() が使用されます。
  * (ol3 API)
  */
 /** ol.control.defaults()
  * デフォルトでは、マップに含まコントロールのセット。
  * 特に設定しない限り、これは、以下の各コントロールの
  * インスタンスを含むコレクションを返します。(ol3 API)
  * ol.control.Zoom, ol.control.Rotate, ol.control.Attribution
  */
  attributionOptions: /** @type {olx.control.AttributionOptions} */ ({
  /** @type 
   * 値のタイプ(型)の説明 - 式などで表示
   * attributionOptions の値の型は、
   * olx.control.AttributionOptions の型を使用。
   * (@use JSDoc[http://usejsdoc.org/]より)
   */
   collapsible: false // 折りたたみ
  })
 }),
 view: new ol.View({
  center: [0, 0],
  zoom: 2
 })
});


2 - ol3ex 26a - GeoJSON example 1

「GeoJSON example(geojson.html)」を参考に地図を表示してみます。

HTML ファイルの作成
a Eclipse のメニューの「ファイル」->「ファイルを開く」をクリックします。


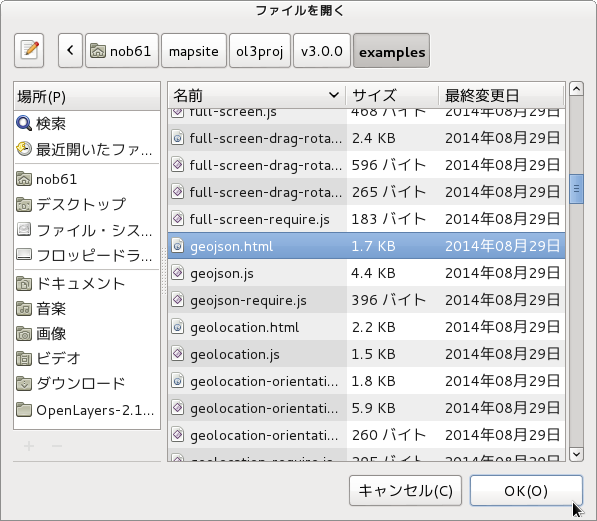
b 「ファイルを開く」ウィンドウで、「user」->「mapsite」->「ol3proj」->「v3.0.0」->「examples」->「geojson.html」をクリックして選択し、「OK」ボタンをクリックします。
同じように「geojson.js」を開きます。


c メニューの「ファイル」->「新規」 -> 「ファイル」をクリックします。


d 「ファイル」ウィンドウで「ol3proj」をクリックして選択し、「ファイル名」を「226-ol3ex.html」と入力し、「次へ」ボタンをクリックします。


e 「File Template」ウィンドウで「HTML 5 Template」をクリックして選択し、「OK」ボタンをクリックします。


f 「geojson.html」の内容をコピーして「226-ol3ex.html」に貼り付け、修正します。
g 同じように、新規に「226-ol3ex.js」ファイルを作成し、「File Template」ウィンドウで「JavaScript Template」をクリックして選択し、「完了」ボタンをクリックして、「geojson.js」の内容をコピーして貼り付け、修正します。「geojson-require.js」も「226-ol3ex-require.js」に貼り付けます。


「226-ol3ex.html」
<!doctype html>
<html lang="en">
 <head>
  <meta charset="utf-8">
  <meta http-equiv="X-UA-Compatible" content="chrome=1">
  <meta name="viewport" content="initial-scale=1.0, user-scalable=no, width=device-width">
<!--
  <link rel="stylesheet" href="../css/ol.css" type="text/css">
  <link rel="stylesheet" href="../resources/bootstrap/css/bootstrap.min.css" type="text/css">
  <link rel="stylesheet" href="../resources/layout.css" type="text/css">
  <link rel="stylesheet" href="../resources/bootstrap/css/bootstrap-responsive.min.css" type="text/css">
-->
  <!-- ディレクトリ修正 -->
  <link rel="stylesheet" href="v3.0.0/css/ol.css" type="text/css">
  <link rel="stylesheet" href="v3.0.0/resources/bootstrap/css/bootstrap.min.css" type="text/css">
  <link rel="stylesheet" href="v3.0.0/resources/layout.css" type="text/css">
  <link rel="stylesheet" href="v3.0.0/resources/bootstrap/css/bootstrap-responsive.min.css" type="text/css">
  <title&gt;GeoJSON example</title>
 </head>
 <body>
  <!-- 
  bootstrap.min.css, bootstrap-responsive.min.css で設定されたセレクタを使用。
  -->
  <div class="navbar navbar-inverse navbar-fixed-top">
   <div class="navbar-inner">
    <div class="container">
<!--
     <a class="brand" href="./"><img src="../resources/logo.png"> OpenLayers 3 Examples</a>
-->
      <!-- ディレクトリ修正 -->
     <a class="brand" href="v3.0.0/examples/"><img src="v3.0.0/resources/logo.png"> OpenLayers 3 Examples</a>
    </div>
   </div>
  </div>
  <div class="container-fluid">
   <div class="row-fluid">
    <div class="span12">
     <div id="map" class="map"></div>
    </div>
   </div>
   <div class="row-fluid">
    <div class="span12">
     <h4 id="title">GeoJSON example</h4>
     <p id="shortdesc">Example of GeoJSON features.</p>
<!--
      <p>See the <a href="geojson.js" target="_blank">geojson.js source</a> to see how this is done.</p>
-->
       <!-- ファイル修正 -->
      <p>See the <a href="226-ol3ex.js" target="_blank">226-ol3ex.js source</a> to see how this is done.</p>
     </div>
     <div id="tags">geojson, vector, openstreetmap</div>
    </div>
   </div>
  </div>
<!--
  <script src="jquery.min.js" type="text/javascript"></script>
  <script src="../resources/example-behaviour.js" type="text/javascript"></script>
-->
  <!-- ディレクトリ修正
   jQuery Minified版と
   example-behaviour.js(Examples用 JSコード[文字コードなど])
  -->
  <script src="v3.0.0/examples/jquery.min.js" type="text/javascript"></script>
  <script src="v3.0.0/resources/example-behaviour.js" type="text/javascript"></script>
<!--
  <script src="loader.js?id=geojson" type="text/javascript"></script>
-->
  <!-- ファイル修正 -->  <!-- ディレクトリ修正 -->
  <script src="loader.js?id=226-ol3ex" type="text/javascript"></script>

 </body>
</html>

2009年11月16日月曜日

OpenLayers 27b ベクトル図の変形 - GeoJson のデータ

GeoJson については以前、「OpenLayers 19d GeoJSON でレイヤ描画」で簡単にふれました。
GeoJSON のホームページ(http://geojson.org/)を参考にして、ポイントを例にデータをもう少し詳しくみてみます。
最初に出てくる

"type": "FeatureCollection"

は、GeoJSON のホームページ(http://geojson.org/)spec サイト(http://geojson.org/geojson-spec.html)の 「2.3 Feature Collection Objects」に
あるように、GeoJson オブジェクトが feature collection オブジェクトであることを宣言しています。
これによって feature オブジェクトも宣言します。

{
"type": "FeatureCollection",
"features": [
{
"type":"Feature",
---

features には他に、"geometry" と "property"(両方必須)、"id" を設定します。

"features": [
{
"type":"Feature",
"id":"OpenLayers.Feature.Vector_1721",
"properties":{},
"geometry":{
"type":"Point",
"coordinates":[-89.296875, -14.4140625]
},
---

続けて、coordinate reference system (CRS: 座標参照システム?)は、crs メンバーで決定します。
オブジェクトが crs メンバーを取得できないときは、デフォルトの CRS が GeoJSON に適用されます。

(GeoJSON のホームページ(http://geojson.org/)spec サイト(http://geojson.org/geojson-spec.html)の「2. GeoJSON Objects」試しに訳してみました)
●デフォルトの CRS は、地理的座標参照システム?で、WGS84(世界で最も汎用される楕円体)データを使い、10進法の度数単位の経緯度で表示します。
●メンバー名「crs」の値は、JSON オブジェクト(下記の CRS オブジェクトとして参照されます)または null 値の JSON でなければなりません。
CRS 値が null のとき、CRS がないと仮定されます。
●crs メンバーは、(feature collection, feature, geometry 順の)ヒエラルキー(段階的分類) で最上位 GeoJSON オブジェクト上に存在し、子または孫オブジェクト上で繰替えされるか無効になります。
●null 値でない CRS オブジェクトは、2つの必須のメンバー type と properties を持ちます。
●type メンバーの値は文字で、CRS オブジェクトの type を示します。
●properties メンバーの値はオブジェクトです。
●CRS は座標の順序を変えられません。

CRS はつぎのように記述します。

"crs":{
"type":"OGC",
"properties":{
"urn":"urn:ogc:def:crs:OGC:1.3:CRS84"
}}
},


Best Practices OGC URNs サイト

http://www.oostethys.org/best-practices/best-practices-ogc-urns

を参考に URN についてみてみます。
一般的な URN の形式は次の様になります。

urn:$organization:string_unique_to_organization

$organization コードは、IANAから要求される正式なコードです。

OGCの内の項目を指定するためのURNの推奨フォームは、OGCの 05-010 によって与えられ、その形式は:

urn:ogc:def:objectType:authority:version:code

: (コロン)は必ず6個必要です。

バージョンがない場合、バージョン文字列は null で、コロンはもう一つのコロンの後に表示されます。

urn:ogc:def:crs:EPSG::4326


使用した GeoJSON データ

ol27_polygon.json の一部

{
"type": "FeatureCollection",
"features": [
{
"type":"Feature",
"id":"OL_Snap_Test_Polygon1",
"properties":{},
"geometry":{
"type":"Polygon",
"coordinates":[
[
[139.1, 35.6],[139.2, 35.7],[139.3, 35.7],[139.4, 35.6],[139.2, 35.5],[139.1, 35.6]
]]},
"crs":{
"type":"OGC",
"properties":{
"urn":"urn:ogc:def:crs:OGC:1.3:CRS84"
}}
},
---

2009年7月11日土曜日

OpenLayers 19d GeoJSON でレイヤ描画

GeoJSON Example(geojson.html)を参考にベクトル図を描画してみます。

最初に、JSON(JavaScript Object Notation)について簡単に説明します。
JSON のホームページ(http://json.org/)よると、JavaScript用の軽量データ交換フォーマットとあります。
その基本的な構造は、

(オブジェクト) { 名前 : 値 }

で、複数の内容はカンマ(,)で区切り、配列にはハッシュ(hash)を使います。

(オブジェクト) { 名前1 : 値1, 名前2 : [ 値2, 値3, 値4 ] }

GeoJSON は、GeoJSON のホームページ(http://geojson.org/)spec サイト(http://geojson.org/geojson-spec.html)の 「1. Introduction」 によると、地理データ構造をエンコーディングするフォーマットです。
GeoJSON で Point は、次のように表記します。

{ "type": "Point", "coordinates": [100.0, 0.0] }

詳しい内容は GeoJSON のホームページの spec サイトをみてください。

OpenLayers の GeoJSON Example(geojson.html)の GeoJSON 部分をみてみます。
(数値は、鎌倉市に描画できるように直してあります。)

次のスクリプトを追加します。

---
// ここから追加
var featurecollection = { //オブジェクトの宣言
"type": "FeatureCollection", //オブジェクトの型
"features": [ //フィーチャズ
{"geometry": { //フィーチャズの地理データ(値が入れ子になっている)
"type": "GeometryCollection", // 「geometry」の型
"geometries": [ //「geometry」の地理データ(ハッシュ配列)
{
"type": "LineString", //「geometry」の地理データ-線
"coordinates": // 座標
[[-26659.018612,-71776.660019], // 経度, 緯度
[-27159.018612,-72276.660019],
[-27159.018612,-72776.660019]]
},
{
"type": "Polygon", //「geometry」の地理データ-ポリゴン
"coordinates":
[[[-27159.018612,-72776.660019],
[-27659.018612,-73276.660019],
[-27359.018612,-73776.660019],
[-26859.018612,-73776.660019],
[-26359.018612,-73276.660019],
[-27159.018612,-72776.660019]]]
},
{
"type":"Point", //「geometry」の地理データ-点
"coordinates":[-26659.018612,-71776.660019]
}
]
},
"type": "Feature", //フィーチャズの型(「Feature」はフィーチャのオブジェクト)
"properties": {}} //「Feature」は必ず「properties」を持ち、値は「JSONオブジェクト」または「null」
]
};

var geojson_format = new OpenLayers.Format.GeoJSON();
var vector_layer = new OpenLayers.Layer.Vector();
map.addLayer(vector_layer);
vector_layer.addFeatures(geojson_format.read(featurecollection));
// ここまで

} // End of function init()
---