ラベル style の投稿を表示しています。 すべての投稿を表示

2018年10月31日水曜日

OpenLayers5 Workshop - 3.4 Making things look bright

3 Vector Tile
3.4 Making things look bright
ものを明るく見せる

There have been many attempts to create tools and formats for styling maps. The most popular formats were probably SLD and CartoCSS. A graphical tool that comes to mind is Atlas Styler. But none of these format or tools were really convenient to use.

マップをスタイルするためにツールとフォーマットを作成する試みがたくさんあります。最も一般的なフォーマットは、おそらく、SLD と CartoCSS です。頭に浮かぶグラフィカルツールは、Atlas Styler です。これらのフォーマット、または、ツールは、使うのに本当に便利ではありません。

Mapbox finally came up with Mapbox Studio, a very user friendly style editor, and the Mapbox Style format. The Mapbox Style format is supported by a growing number of applications, and a graphical Open Source editor, Maputnik, is available for creating and modifying Mapbox Style files.

Mapbox は、とても使いやすいスタイルエディタ、Mapbox Studio と Mapbox Style フォーマットをついに出しました。Mapbox Style フォーマットは、増え続けるアプリケーションによって支援され、グラフィカル Open Source エディタ Maputnik は、Mapbox Style ファイルを作成し編集することに利用できます。

The ol-mapbox-style package adds support for the Mapbox Style format to OpenLayers. Let's see if we can get a nicer looking map than the one from the previous exercise.

ol-mapbox-style パッケージは、OpenLayers に Mapbox Style フォーマットのためのサポートを追加します。前回の演習からより見栄えの良いマップを取得できるかみてみます。

Creating Mapbox Style files in Maputnik
Maputnik で Mapbox Style ファイルを作成

You can play with a live instance of Maputnik at https://maputnik.github.io/editor/, or download and install it locally. I have created a file with our ugly style. You can download that file, ugly.json, and open it in Maputnik to verify it looks just as ugly there as it does in our OpenLayers application:

https://maputnik.github.io/editor/ にあるか、または、ローカルでダウンロードしインストールして Maputnik のインスタンス化で楽しめます。私は ugly スタイルでファイルを作成しています。あなたはそのファイル、ugly.json をダウンロードし、OpenLayers アプリケーションで実行するのと同じようにそこで ugly かを確かめるために Maputnik で開きます。

Ugly style in Maputnik

Create a map from a Mapbox Style in OpenLayers
OpenLayers で Mapbox Style からマップを作成

We'll import the apply function from the ol-mapbox-style package, so we can simply have a map with all the contents from a style file rendered into our map-container. But first we need to install the package:

ol-mapbox-style から apply ファンクションをインポートすると、map-container に描画されたスタイルファイルからすべてのコンテンツと一緒にマップを簡単に持つことができます。しかし、最初にパッケージをインストールする必要があります:

npm install ol-mapbox-style@beta

(訳注:実施には npm install ol-mapbox-style)

Now we can import the function into our main.js:

main.js にファンクションをインポートします:

import {apply} from 'ol-mapbox-style';

We can also remove all other imports except for these two:

これら2つを除いて他のインポートすべても削除します:
import 'ol/ol.css';
import Overlay from 'ol/Overlay';
While we are at cleaning up, we can also delete the key, map, layer definitions. And we can – of course – remove all the style code. Finally, in index.html, we can remove the line that adds the Open Sans font, and the background-color for the map.

クリーンアップの間、key、map、layer 定義も削除できます。そして、もちろん、スタイルコードをすべて削除できます。最後に、index.html で Open Sans ファンとを追加するラインとマップの background-color を削除します。

Instead of the previous map code, we need a single line to create a map from our ugly Mapbox style, which we insert below our imports:

前述のマップコードのかわりに、ugly Mapbox スタイルからマップを作成するための1つのラインが必要で、import の下に挿入します:

const map = apply('map-container', './data/ugly.json');

This should give us the same ugly map as before, just with less application code. But hey, we wanted to make things look bright, and not look at an ugly map again. So let's open the 'OSM Bright' from Maputnik's Gallery Styles, and use that. I have prepared it already, and made the result available as http://localhost:3000/data/bright.json. So let's change the apply() line to

これは前回と同じ ugly map を、より少ないアプリケーションコードで、与えます。しかし、おい、明るく見せたいし、また、 ugly(見苦しい)マップを見たくありません。それでは、Maputnik's Gallery Styles から 'OSM Bright' を開き、それを使います。それはすでに準備されていて、http://localhost:3000/data/bright.json として結果を利用できます。それでは、 apply() ラインを変更します:

const map = apply('map-container', './data/bright.json');

What a relief. Finally we can enjoy a nice looking world map, and zoom to Boston!

ホッとしました。最後に、見栄えの良い世界地図を楽しみ、ボストンにズームインします。

A bright map of Boston

And note that our map is still interactive, meaning you get an info popup when you click on any geometry.

このマップは、まだ、インタラクティブな状態で、ジオメトリをクリックしたとき情報ポッパップを取得することに注意してください。


■□ Debian9 で試します■□
「Interact with VectorTile features」の例を表示します。 最初に、ol-mapbox-style パッケージをインストールします。

nob61@deb9-vmw:~/openlayers-workshop-en$ npm install ol-mapbox-style@beta
npm WARN extract-text-webpack-plugin@3.0.2 requires a peer of webpack@^3.1.0 but none is installed. You must install peer dependencies yourself.

+ ol-mapbox-style@3.0.0-beta.9
added 2 packages from 1 contributor, removed 16 packages, updated 3 packages and audited 7504 packages in 10.782s found 0 vulnerabilities

「Styling a VectorTile layer」で使用した index.html のバックアップを保存して次のように修正します。

user@deb9-vmw:~/openlayers-workshop-en$ cp index.html index.html_styling
user@deb9-vmw:~/openlayers-workshop-en$ vim index.html
<!DOCTYPE html>
<html>
 <head>
  <meta charset="utf-8">
  <title>OpenLayers</title>
  <style>
   html, body, #map-container {
    margin: 0;
    height: 100%;
    width: 100%;
    font-family: sans-serif;
    background-color: rgb(248, 244, 240);
   }
   .arrow_box {
    position: relative;
    background: #000;
    border: 1px solid #003c88;
   }
   .arrow_box:after, .arrow_box:before {
    top: 100%;
    left: 50%;
    border: solid transparent;
    content: " ";
    height: 0;
    width: 0;
    position: absolute;
    pointer-events: none;
   }
   .arrow_box:after {
    border-color: rgba(0, 0, 0, 0);
    border-top-color: #000;
    border-width: 10px;
    margin-left: -10px;
   }
   .arrow_box:before {
    border-color: rgba(0, 60, 136, 0);
    border-top-color: #003c88;
    border-width: 11px; 
    margin-left: -11px; 
   } 
   .arrow_box { 
    border-radius: 5px; 
    padding: 10px; 
    opacity: 0.8; 
    background-color: black; 
    color: white; 
   }
   #popup-content { 
    max-height: 200px; 
    overflow: auto; 
   } 
   #popup-content th { 
    text-align: left; 
    width: 125px; 
   }
  </style>
 </head>
 <body>
  <div id="map-container"></div>
  <div class="arrow_box" id="popup-container"> 
   <div id="popup-content"></div>
  </div>
 </body>
</html>
「Styling a VectorTile layer」」で使用した main.js のバックアップを保存して次のように修正します。削除するインポート(import)、key、layer、map の定義などは、ugly.json ファイルに記述されています。

user@deb9-vmw:~/openlayers-workshop-en$ cp main.js main.js_styling
user@deb9-vmw:~/openlayers-workshop-en$ vim main.js
import 'ol/ol.css';
import Overlay from 'ol/Overlay';
import {apply} from 'ol-mapbox-style'; 
const map = apply('map-container', './data/ugly.json'); 
const overlay = new Overlay({
 element: document.getElementById('popup-container'),
 positioning: 'bottom-center',
 offset: [0, -10],
 autoPan: true
});
map.addOverlay(overlay);
overlay.getElement().addEventListener('click', function() {
 overlay.setPosition();
});
map.on('click', function(e) {
 let markup = '';
 map.forEachFeatureAtPixel(e.pixel, function(feature) {
  markup += `${markup && '<hr>'}<table>`;
  const properties = feature.getProperties();
  for (const property in properties) {
   markup += `<tr><th>${property}</th><td>${properties[property]}</td></tr>`;
  }
  markup += '</table>';
 }, {hitTolerance: 1});
 if (markup) {
  document.getElementById('popup-content').innerHTML = markup;
  overlay.setPosition(e.coordinate);
 }
});
'npm start' を実行すると次のようなメッセージが表示され、コンパイルできませんました。

nob61@deb9-vmw:~/openlayers-workshop-en$ npm start
$gt; ol-workshop@0.0.0 start /home/nob61/openlayers-workshop-en
$gt; webpack-dev-server --mode=development

ℹ 「wds」: Project is running at http://localhost:3000/
ℹ 「wds」: webpack output is served from /
✖ 「wdm」: 
ERROR in ./node_modules/@mapbox/mapbox-gl-style-spec/util/color.js
Module parse failed: Unexpected token (17:5)
You may need an appropriate loader to handle this file type.
|  */
| class Color {
|     r: number;
|     g: number;
|     b: number;
 @ ./node_modules/ol-mapbox-style/index.js 23:0-60 190:38-43
 @ ./main.js
 @ multi (webpack)-dev-server/client?http://localhost:3000 ./main.js
---
ℹ 「wdm」: Failed to compile.

OpenLayers5 Workshop - 3.3 Styling a VectorTile layer

3 Vector Tile
3.3 Styling a VectorTile layer
VectorTile レイヤをスタイルする

Styling a vector tile layer works exactly the same way as styling a vector layer. We will now try to style our world map so it actually looks like a world map is supposed to look.

ベクタタイルレイヤをスタイルすることは、ベクタレイヤをスタイルするのと全く同じ方法で動作します。実際に見るはずの世界地図のように見えるよう世界地図をスタイルしてみます。

Load fonts
フォントをロードする

Let's say we want to use a nicer font for labels in our map. I decided to use the Open Sans font family, which can easily be loaded with an additional stylesheet in the <head> of our index.html:

マップでラベルに見た目が良いフォントを使いたいとします。Open Sans フォントファミリを使うことを決めましたが、index.html の <head> に追加のスタイルシートを使って簡単にロードできます。

<link href="https://fonts.googleapis.com/css?family=Open+Sans" rel="stylesheet">

Set a map background
マップの背景を設定する

A common style element in vector tile maps is a background color, which the user sees in places that are not covered by any geometries. Like we already saw in the vector exercise, this can be done by simply setting a background color in a <style> for the #map-container:

ベクタタイルマップで一般的なスタイルエレメントは背景色(background color)ですが、どのジオメトリにも覆われていない場所に見られます。すでにベクタ演習で見られたように、これは #map-container の <style> に背景色を単純に設定することによって実行できます。

background-color: rgb(248, 244, 240);

Style the layer with a style function
style ファンクションを使ってレイヤをスタイルする

Now we are going to add some application code to main.js.

では、main.js にいくつかアプリケーションコードを追加します。

First, we'll need imports for the styles we are going to use:

最初に、使うスタイルのインポートが必要です:

import {Style, Fill, Stroke, Circle, Text} from 'ol/style';
// import {createDefaultStyle} from 'ol/style/Style';
The style function is a bit long:

style ファンクションは少し長いです:
layer.setStyle(function(feature, resolution) {
 const properties = feature.getProperties();
 // Water polygons
 if (properties.layer == 'water') {
  return new Style({
   fill: new Fill({
    color: 'rgba(0, 0, 255, 0.7)'
   })
  });
 }
 // Boundary lines
 if (properties.layer == 'boundary' && properties.admin_level == 2) {
  return new Style({
   stroke: new Stroke({
    color: 'gray'
   })
  });
 }
 // Continent labels
 if (properties.layer == 'place' && properties.class == 'continent') {
  return new Style({
   text: new Text({
    text: properties.name,
    font: 'bold 16px Open Sans',
    fill: new Fill({
     color: 'black'
    }),
    stroke: new Stroke({
     color: 'white'
    })
   })
  });
 }
 // Country labels
 if (properties.layer == 'place' && properties.class == 'country' &&
  resolution < map.getView().getResolutionForZoom(5)) {
   return new Style({
    text: new Text({
     text: properties.name,
     font: 'normal 13px Open Sans',
     fill: new Fill({
      color: 'black'
     }),
     stroke: new Stroke({
      color: 'white'
     })
    })
   });
 }
 // Capital icons and labels
 if (properties.layer == 'place' && properties.capital) {
  const point = new Style({
   image: new Circle({
    radius: 5,
    fill: new Fill({
     color: 'black'
    }),
    stroke: new Stroke({
     color: 'gray'
    })
   })
  });
  if (resolution < map.getView().getResolutionForZoom(6)) {
   point.setText(new Text({
    text: properties.name,
    font: 'italic 12px Open Sans',
    offsetY: -12,
     fill: new Fill({
      color: '#013'
     }),
     stroke: new Stroke({
      color: 'white'
     })
   }));
  }
  return point;
 }
 // return createDefaultStyle(feature, resolution);
});
I think you will agree that we have not reached our goal of creating a beautiful world map:

美しい世界地図を作成する最終目的に達していないと考えていると思います:

An ugly world map

There is much more effort involved in styling a world map appropriately, and writing a style function in JavaScript is probably not the right tool. In the next exercise, we will learn a different way of loading and styling vector tile layers.

適切に世界地図をスタイリングするものに含まれているもっとたくさんの効果があり、JavaScript に style ファンクションを書くことは、おそらく正しいツールではありません。この演習で、ベクタタイルレイヤをロードしスタイリングする難しい方法を学びます。

■□ Debian9 で試します■□
「Interact with VectorTile features」の例を表示します。「The VectorTile layer」で使用した index.html のバックアップを保存して次のように修正します。

user@deb9-vmw:~/openlayers-workshop-en$ cp index.html index.html_interact
user@deb9-vmw:~/openlayers-workshop-en$ vim index.html
<!DOCTYPE html>
<html>
 <head>
  <meta charset="utf-8">
  <title>OpenLayers</title>
  <link href="https://fonts.googleapis.com/css?family=Open+Sans" rel="stylesheet"> 
  <style>
   html, body, #map-container {
    margin: 0;
    height: 100%;
    width: 100%;
    font-family: sans-serif;
    background-color: rgb(248, 244, 240);
   }
   .arrow_box {
    position: relative;
    background: #000;
    border: 1px solid #003c88;
   }
   .arrow_box:after, .arrow_box:before {
    top: 100%;
    left: 50%;
    border: solid transparent;
    content: " ";
    height: 0;
    width: 0;
    position: absolute;
    pointer-events: none;
   }
   .arrow_box:after {
    border-color: rgba(0, 0, 0, 0);
    border-top-color: #000;
    border-width: 10px;
    margin-left: -10px;
   }
   .arrow_box:before {
    border-color: rgba(0, 60, 136, 0);
    border-top-color: #003c88;
    border-width: 11px; 
    margin-left: -11px; 
   } 
   .arrow_box { 
    border-radius: 5px; 
    padding: 10px; 
    opacity: 0.8; 
    background-color: black; 
    color: white; 
   }
   #popup-content { 
    max-height: 200px; 
    overflow: auto; 
   } 
   #popup-content th { 
    text-align: left; 
    width: 125px; 
   }
  </style>
 </head>
 <body>
  <div id="map-container"></div>
  <div class="arrow_box" id="popup-container"> 
   <div id="popup-content"></div>
  </div>
 </body>
</html>
「The VectorTile layer」」で使用した main.js のバックアップを保存して次のように修正します。

user@deb9-vmw:~/openlayers-workshop-en$ cp main.js main.js_interact
user@deb9-vmw:~/openlayers-workshop-en$ vim main.js
import 'ol/ol.css';
import Map from 'ol/Map';
import View from 'ol/View';
import MVT from 'ol/format/MVT';
import VectorTileLayer from 'ol/layer/VectorTile';
import VectorTileSource from 'ol/source/VectorTile';
import Overlay from 'ol/Overlay';
// See https://openmaptiles.com/hosting/ for terms and access key
const key = '<your-access-key-here>';
const map = new Map({
 target: 'map-container',
 view: new  View({
  center: [0, 0],
  zoom: 2
 })
});
const layer = new VectorTileLayer({
 source: new VectorTileSource({
  attributions: [
   '<a href="http://www.openmaptiles.org/" target="_blank">&copy; OpenMapTiles</a>',
   '<a href="http://www.openstreetmap.org/about/" target="_blank">&copy; OpenStreetMap contributors</a>'
  ],
  format: new MVT(),
  url: `https://free-{1-3}.tilehosting.com/data/v3/{z}/{x}/{y}.pbf.pict?key=${key}`,
  maxZoom: 14
 })
});
map.addLayer(layer); 
const overlay = new Overlay({
 element: document.getElementById('popup-container'),
 positioning: 'bottom-center',
 offset: [0, -10],
 autoPan: true
});
map.addOverlay(overlay);
overlay.getElement().addEventListener('click', function() {
 overlay.setPosition();
});
map.on('click', function(e) {
 let markup = '';
 map.forEachFeatureAtPixel(e.pixel, function(feature) {
  markup += `${markup && '<hr>'}<table>`;
  const properties = feature.getProperties();
  for (const property in properties) {
   markup += `<tr><th>${property}</th><td>${properties[property]}</td></tr>`;
  }
  markup += '</table>';
 }, {hitTolerance: 1});
 if (markup) {
  document.getElementById('popup-content').innerHTML = markup;
  overlay.setPosition(e.coordinate);
 } else {
  overlay.setPosition();
 }
});
layer.setStyle(function(feature, resolution) {
 const properties = feature.getProperties();
 // Water polygons
 if (properties.layer == 'water') {
  return new Style({
   fill: new Fill({
    color: 'rgba(0, 0, 255, 0.7)'
   })
  });
 }
 // Boundary lines
 if (properties.layer == 'boundary' && properties.admin_level == 2) {
  return new Style({
   stroke: new Stroke({
    color: 'gray'
   })
  });
 }
 // Continent labels 
 if (properties.layer == 'place' && properties.class == 'continent') {
  return new Style({
   text: new Text({
    text: properties.name,
    font: 'bold 16px Open Sans',
    fill: new Fill({
     color: 'black'
    }),
    stroke: new Stroke({
     color: 'white'
    })
   })
  });
 }
 // Country labels 
 if (properties.layer == 'place' && properties.class == 'country' &&
     resolution < map.getView().getResolutionForZoom(5)) {
  return new Style({
   text: new Text({
    text: properties.name,
    font: 'normal 13px Open Sans',
    fill: new Fill({
     color: 'black'
    }),
    stroke: new Stroke({
     color: 'white'
    })
   })
  });
 }
 // Capital icons and labels 
 if (properties.layer == 'place' && properties.capital) {
  const point = new Style({
   image: new Circle({
    radius: 5,
    fill: new Fill({
     color: 'black'
    }),
    stroke: new Stroke({
     color: 'gray'
    })
   })
  });
  if (resolution < map.getView().getResolutionForZoom(6)) {
   point.setText(new Text({
    text: properties.name,
    font: 'italic 12px Open Sans',
    offsetY: -12,
    fill: new Fill({
     color: '#013'
    }),
    stroke: new Stroke({
     color: 'white'
    })
   }));
  }
  return point;
 }
 // return createDefaultStyle(feature, resolution);
});
http://localhost:3000/ とブラウザでマップを開きます。(もし開かなければ、'npm start' を実行してください。


2018年9月26日水曜日

OpenLayers5 Workshop - 2.7 Making it look nice

2 Vector Data
2.7 Making it look nice
見栄えを良くする

At this point we have a feature editor with basic import, editing, and export functionality. But we haven't spent any time trying to make the features look nice. When you create a vector layer in OpenLayers, you get a set of default styles. The editing interactions (draw and modify) also come with their own default styles. You may have noticed how geometries had a thicker stroke during editing. This behavior can be controlled by providing a style option to your vector layer and editing interactions.

このポイントは、基本的なインポートと編集、エクスポート機能があるフィーチャエディタがあります。しかし、フィーチャの見栄えを良くさせる試みに全く時間を使っていません。OpenLayers でベクタレイヤを作成するとき、一連のデフォルトスタイルを取得します。editing インストラクション(draw と modify)も、それら自身のデフォルトスタイルを備えています。ジオメトリは編集中により太いストロークをどのように持っていたか気がついているでしょう。この動作は、ベクタレイヤにスタイルオプションと editing インストラクションを提供することによって制御されます。

Static style
静的スタイル

If we wanted to give all features the same style, we could configure our vector layer like this:

もしすべてのフィーチャに同じスタイルを与えるなら、ベクタレイヤをこのように設定します:
const layer = new VectorLayer({
 source: source,
 style: new Style({
  fill: new Fill({
   color: 'red'
  }),
  stroke: new Stroke({
   color: 'white'
  })
 })
});
It is also possible to set the style property to an array of styles. This allows rendering of a cased line (a wide stroke below and a narrower one on top), for example.

スタイルプロパティをスタイルの配列に設定することも可能です。例えば、台形ライン(下が広く上が狭いストローク)の描画を許可します。

While there isn't really a good justification of it here, for the sake of this exercise we'll take advantage of dynamic styling.

その良い根拠はここには本当にないですが、この演習のために、動的スタイリングの有利な点を使用します。

Dynamic style
動的スタイル

When you want to make decisions about how each feature should get rendered based on something about the feature or the current view resolution, you can configure a vector layer with a style function. This function gets called with each feature at each render frame, so it is important to write an efficient function if you have many features and want to maintain good rendering performance.

各々のフィーチャがフィーチャと現在のビューの投影法を元に描画される方法について決定するとき、ベクタレイヤをスタイル(style)ファンクションで設定できます。このファンクションは各々の描画フレームの各々のフィーチャで呼び出されるので、多くのフィーチャがあり良好な描画パフォーマンスを維持したいなら効率的なファンクションを書くことが重要です。

Here is an example that renders features using one of two styles depending on whether the "name" attribute starts with "A-M" or "N-Z" (a completely contrived example).

ここに "name" 属性が "A-M" または "N-Z" で開始するかによる2つのスタイルの1つを使用してフィーチャを描画する(全く不自然な)例があります。
const layer = new VectorLayer({
 source: source,
 style: function(feature, resolution) {
  const name = feature.get('name').toUpperCase();
  return name < "N" ? style1 : style2; // assuming these are created elsewhere
 }
});
Styling based on geometry area
ジオメトリエリアを元とするスタイリング

To see how dynamic styling works, we'll create a style function that renders features based on the geometry area. To do this, we're going to make use of a colormap package on npm. We can add this to our dependencies like this:

動的スタイリングがどのように動作するかを確認するために、ジオメトリエリアを元とするフィーチャを描画するスタイルファンクションを作成します。これを実行するために、npm の colormap パッケージを使用します。これを依存関係にこのように追加します:

npm install colormap

Now, we need to import the style constructors, the colormap package, and ol/sphere for spherical area calculations.

では、スタイルコンストラクタと colormap パッケージ、球面の計算のための ol/sphere をインポートします。
import {Fill, Stroke, Style} from 'ol/style';
import {getArea} from 'ol/sphere';
import colormap from 'colormap';
Next we'll write a couple functions to determine a color based on the area of a geometry:

次に、ジオメトリの面積をもととする色を決定する対のファンクションを書きます:
const min = 1e8; // the smallest area
const max = 2e13; // the biggest area
const steps = 50;
const ramp = colormap({
 colormap: 'blackbody',
 nshades: steps
});
function clamp(value, low, high) {
 return Math.max(low, Math.min(value, high));
}
function getColor(feature) {
 const area = getArea(feature.getGeometry());
 const f = Math.pow(clamp((area - min) / (max - min), 0, 1), 1 / 2);
 const index = Math.round(f * (steps - 1));
 return ramp[index];
}
And now we can add a function that creates a style with a fill color based on the geometry area. Set this function as the style property of your vector layer:

それでは、ジオメトリの面積をもとに塗りつぶし色(fill color)でスタイルを作成するのファンクションを追加できます。このファンクションをベクタレイヤのスタイルプロパティとして設定します:
const layer = new VectorLayer({
 source: source,
 style: function(feature) {
  return new Style({
   fill: new Fill({
    color: getColor(feature)
   }),
   stroke: new Stroke({
    color: 'rgba(255,255,255,0.8)'
   })
  });
 }
});
Features colored by area

■□ Debian9 で試します■□
「Static style」の例を表示します。前回使用した main.js のバックアップを保存して次のように修正します。

user@deb9-vmw:~/openlayers-workshop-en$ cp main.js main.js_dawnload user@deb9-vmw:~/openlayers-workshop-en$ vim main.js
import 'ol/ol.css';
import GeoJSON from 'ol/format/GeoJSON':
import Map from 'ol/Map';
import VectorLayer from 'ol/layer/Vector';
import VectorSource from 'ol/source/Vector';
import View from 'ol/View';
import DragAndDrop from 'ol/interaction/DragAndDrop';
import Modify from 'ol/interaction/Modify';
import Draw from 'ol/interaction/Draw';
import Snap from 'ol/interaction/Snap';
import sync from 'ol-hashed';
import Style from 'ol/style/Style';
import Fill from 'ol/style/Fill';
import Stroke from 'ol/style/Stroke';
const map = new Map({
 target: 'map-container',
 view: new View({
  center: [0, 0],
  zoom: 2
 })
}); 
sync(map);
const source = new VectorSource();

const layer = new VectorLayer({
 source: source,
 style: new Style({
  fill: new Fill({
   color: 'red'
  }),
  stroke: new Stroke({
   color: 'white'
  })
 })
});
map.addLayer(layer);
map.addInteraction(new DragAndDrop({
 source: source,
 formatConstructors: [GeoJSON]
}));

map.addInteraction(new Modify({
 source: source
}));

map.addInteraction(new Draw({
 type: 'Polygon',
 source: source
}));

map.addInteraction(new Snap({
 source: source
}));
const clear = document.getElementById('clear');
clear.addEventListener('click', function() {
 source.clear();
});
const format = new GeoJSON({featureProjection: 'EPSG:3857'});
const download = document.getElementById('download');
source.on('change', function() {
 const features = source.getFeatures();
 const json = format.writeFeatures(features);
 download.href = 'data:text/json;charset=utf-8,' + json;
});
http://localhost:3000/ とブラウザでマップを開きます。(もし開かなければ、'npm start' を実行してください。


「Dynamic style」の例を表示します。main.js を次のように修正します。

user@deb9-vmw:~/openlayers-workshop-en$ vim main.js
import 'ol/ol.css';
import GeoJSON from 'ol/format/GeoJSON':
import Map from 'ol/Map';
import VectorLayer from 'ol/layer/Vector';
import VectorSource from 'ol/source/Vector';
import View from 'ol/View';
import DragAndDrop from 'ol/interaction/DragAndDrop';
import Modify from 'ol/interaction/Modify';
import Draw from 'ol/interaction/Draw';
import Snap from 'ol/interaction/Snap';
import sync from 'ol-hashed';
import Style from 'ol/style/Style';
import Fill from 'ol/style/Fill';
import Stroke from 'ol/style/Stroke';
const map = new Map({
 target: 'map-container',
 view: new View({
  center: [0, 0],
  zoom: 2
 })
}); 
sync(map);

const source = new VectorSource();
/**
 * const layer = new VectorLayer({
 *  source: source,
 *  style: new Style({
 *   fill: new Fill({
 *    color: 'red'
 *    }),
 *   stroke: new Stroke({
 *    color: 'white'
 *   })
 *  })
 * });
 */
const layer = new VectorLayer({
 source: source,
 style: function(feature, resolution) {
  const name = feature.get('name').toUpperCase();
   return name < "N" ? style1 : style2;
 }
});
const style1 = new Style({
 fill: new Fill({
  color: 'red'
  }),
 stroke: new Stroke({
  color: 'white'
 })
});
const style2 = new Style({
 fill: new Fill({
  color: 'blue'
  }),
 stroke: new Stroke({
  color: 'yellow'
 })
});
map.addLayer(layer);
map.addInteraction(new DragAndDrop({
 source: source,
 formatConstructors: [GeoJSON]
}));

map.addInteraction(new Modify({
 source: source
}));

map.addInteraction(new Draw({
 type: 'Polygon',
 source: source
}));

map.addInteraction(new Snap({
 source: source
}));
const clear = document.getElementById('clear');
clear.addEventListener('click', function() {
 source.clear();
});
const format = new GeoJSON({featureProjection: 'EPSG:3857'});
const download = document.getElementById('download');
source.on('change', function() {
 const features = source.getFeatures();
 const json = format.writeFeatures(features);
 download.href = 'data:text/json;charset=utf-8,' + json;
});
http://localhost:3000/ とブラウザでマップを開きます。


「Styling based on geometry area」の例を表示します。 colormap パッケージをインストールします。

npm install colormap

main.js を次のように修正します。

user@deb9-vmw:~/openlayers-workshop-en$ vim main.js
import 'ol/ol.css';
import GeoJSON from 'ol/format/GeoJSON':
import Map from 'ol/Map';
import VectorLayer from 'ol/layer/Vector';
import VectorSource from 'ol/source/Vector';
import View from 'ol/View';
import DragAndDrop from 'ol/interaction/DragAndDrop';
import Modify from 'ol/interaction/Modify';
import Draw from 'ol/interaction/Draw';
import Snap from 'ol/interaction/Snap';
import sync from 'ol-hashed';
import {Fill, Stroke, Style} from 'ol/style';
import {getArea} from 'ol/sphere';
import colormap from 'colormap'; 
const min = 1e8; // the smallest area
const max = 2e13; // the biggest area
const steps = 50;
const ramp = colormap({
 colormap: 'blackbody',
 nshades: steps
});
function clamp(value, low, high) {
 return Math.max(low, Math.min(value, high));
}
function getColor(feature) {
 const area = getArea(feature.getGeometry());
 const f = Math.pow(clamp((area - min) / (max - min), 0, 1), 1 / 2);
 const index = Math.round(f * (steps - 1));
 return ramp[index];
}
const map = new Map({
 target: 'map-container',
 view: new View({
  center: [0, 0],
  zoom: 2
 })
}); 
sync(map);

const source = new VectorSource();
/**
 * const layer = new VectorLayer({
 *  source: source,
 *  style: new Style({
 *   fill: new Fill({
 *    color: 'red'
 *    }),
 *   stroke: new Stroke({
 *    color: 'white'
 *   })
 *  })
 * });
 */
/**
 * const layer = new VectorLayer({
 *  source: source,
 *  style: function(feature, resolution) {
 *   const name = feature.get('name').toUpperCase();
 *    return name < "N" ? style1 : style2;
 *  }
 * });
 * const style1 = new Style({
 *  fill: new Fill({
 *   color: 'red'
 *   }),
 *  stroke: new Stroke({
 *   color: 'white'
 *  })
 * });
 * const style2 = new Style({
 *  fill: new Fill({
 *   color: 'blue'
 *   }),
 *  stroke: new Stroke({
 *   color: 'yellow'
 *  })
 * });
 */
const layer = new VectorLayer({
 source: source,
 style: function(feature) {
  return new Style({
   fill: new Fill({
    color: getColor(feature)
   }),
   stroke: new Stroke({
    color: 'rgba(255,255,255,0.8)'
   })
  });
 }
});
map.addLayer(layer);
map.addInteraction(new DragAndDrop({
 source: source,
 formatConstructors: [GeoJSON]
}));

map.addInteraction(new Modify({
 source: source
}));

map.addInteraction(new Draw({
 type: 'Polygon',
 source: source
}));

map.addInteraction(new Snap({
 source: source
}));
const clear = document.getElementById('clear');
clear.addEventListener('click', function() {
 source.clear();
});
const format = new GeoJSON({featureProjection: 'EPSG:3857'});
const download = document.getElementById('download');
source.on('change', function() {
 const features = source.getFeatures();
 const json = format.writeFeatures(features);
 download.href = 'data:text/json;charset=utf-8,' + json;
});
http://localhost:3000/ とブラウザでマップを開きます。


2015年8月26日水曜日

18 - 重ねた地図をもう少し 3 - 各レイヤのスタイル

18-3 自然公園地域のスタイルを設定
18-3-1 自然公園 shizenkoen
国土数値情報 3. 地域 <保護保全> 自然公園地域

18-3-1-1 自然公園のスタイルの設定
行政区画用のスタイル kukaku をコピーして、自然公園(東京)用のスタイル shizenkoen を設定しました。
1 左側の欄の「データ」の「スタイル」をクリックします。


2 「スタイル」の「新規スタイル追加」をクリックします。


3 「新規スタイル」で次のように入力します。

ユーザ名: shizenkoen
ワークスペース: npn
Format: SLD(変更なし)


4 「既存のスタイルをコピーしています」で「npn:kukaku」を選択し「コピーしています」をクリックます。
SLD を入力する欄に「kukaku」の内容が表示されます。


5 内容を次のように変更します。

---
<Title>Shizen Koen: Simple polygon with stroke</Title>
---
<Fill>
 <CssParameter name="fill">#FFCCCC</CssParameter>
</Fill>
<Stroke>
 <CssParameter name="stroke">#FF0000</CssParameter>
 <CssParameter name="stroke-width">1</CssParameter>
</Stroke>
---

6 ページ下の「検証」ボタンをクリックします。


問題なければページ上部に次のように表示されます。


7 ページ下の「送信」ボタンをクリックします。
shizenkoen が追加されました。


18-3-1-2 自然公園のスタイルの適用
1 左側の欄の「データ」の「レイヤ」をクリックします。


2 「shizenkoen」をクリックします。


3 ページ上部の「公開」タブをクリックします。

4 「WMS設定」の「デフォルトスタイル」で「npn:shizenkoen」を選択し、「保存」ボタンをクリックします。


18-3-1-3 自然公園のスタイルの確認
1 左側の欄の「データ」の「レイヤプレビュー」をクリックします。


2 「shizenkoen」を検索し、「共通フォーマット」列の「OpenLayers」をクリックします。


3 成功すれば、OpenLayers Map がポリゴンで表示されます。


同じように他のレイヤのスタイルも設定します。

18-3-2 特別地域 tokubetsu
国土数値情報 3. 地域 <保護保全> 自然公園地域
内容を次のように変更します。

---
<Title>Tokubetsu Chiiki: Simple polygon with stroke</Title>
---
<Fill>
 <CssParameter name="fill">#CCFF99</CssParameter>
</Fill>
<Stroke>
 <CssParameter name="stroke">#00FF00</CssParameter>
 <CssParameter name="stroke-width">1</CssParameter>
</Stroke>
---

18-3-3 特別保護地域 tokubetsuhogo
国土数値情報 3. 地域 <保護保全> 自然公園地域
内容を次のように変更します。

---
<Title>Tokubetsu Hogo Chiiki: Simple polygon with stroke</Title>
---
<Fill>
 <CssParameter name="fill">#CCCCFF</CssParameter>
</Fill>
<Stroke>
 <CssParameter name="stroke">#0000FF</CssParameter>
 <CssParameter name="stroke-width">1</CssParameter>
</Stroke>
---

18-4 あきる野市のスタイルを設定
18-4-1 町字界線 choazakaisen
GeoServer 2.7.x User Manual »
 Styling »
 SLD Cookbook »
 Lines
http://docs.geoserver.org/stable/en/user/styling/sld-cookbook/lines.html

の「Dashed line」を参考にします。
<?xml version="1.0" encoding="UTF-8"?>
<StyledLayerDescriptor 
---
<!-- ヘッダーの内容は同じです -->
 <NamedLayer>
  <Name>Dashed line</Name>
  <UserStyle>
   <Title>Choazakai Sen: Dashed line</Title>
   <FeatureTypeStyle>
    <Rule>
     <LineSymbolizer>
      <Stroke>
       <CssParameter name="stroke">#999900</CssParameter>
       <CssParameter name="stroke-width">1</CssParameter>
       <CssParameter name="stroke-dasharray">5 2</CssParameter>
      </Stroke>
     </LineSymbolizer>
    </Rule>
   </FeatureTypeStyle>
  </UserStyle>
 </NamedLayer>
</StyledLayerDescriptor>

18-4-2 町字界点 choazakaiten

GeoServer 2.7.x User Manual »
 Styling »
 SLD Cookbook »
 Points
http://docs.geoserver.org/stable/en/user/styling/sld-cookbook/points.html#simple-point

の「Point with default label」を参考にします。
<?xml version="1.0" encoding="UTF-8"?>
<StyledLayerDescriptor 
---
<!-- ヘッダーの内容は同じです -->
 <NamedLayer>
  <Name>Point with styled label</Name>
  <UserStyle>
   <Title>Choazakai Ten: Point with styled label</Title>
   <FeatureTypeStyle>
    <Rule>
     <MaxScaleDenominator>10000</MaxScaleDenominator>
     <PointSymbolizer>
      <Graphic>
       <Mark>
        <WellKnownName>circle</WellKnownName>
        <Fill>
         <CssParameter name="fill">#FF0000</CssParameter>
        </Fill>
       </Mark>
       <Size>6</Size>
      </Graphic>
     </PointSymbolizer>
     <TextSymbolizer>
      <Label>
       <ogc:PropertyName>name</ogc:PropertyName>
      </Label>
      <Font>
       <CssParameter name="font-family">kochi-gothic</CssParameter>
       <CssParameter name="font-size">12</CssParameter>
      </Font>
      <LabelPlacement>
       <PointPlacement>
        <AnchorPoint>
         <AnchorPointX>0.5</AnchorPointX>
         <AnchorPointY>0.0</AnchorPointY>
        </AnchorPoint>
        <Displacement>
         <DisplacementX>0</DisplacementX>
         <DisplacementY>5</DisplacementY>
        </Displacement>
       </PointPlacement>
      </LabelPlacement>
      <Fill>
       <CssParameter name="fill">#000000</CssParameter>
      </Fill>
     </TextSymbolizer>
    </Rule>
   </FeatureTypeStyle>
  </UserStyle>
 </NamedLayer>
</StyledLayerDescriptor>
18-4-2 建築物 kenchikubutsu 行政区画用のスタイル kukaku をコピーして、建築物(あきる野市)用のスタイル kenchikubutsu を設定しました。
---
<Title>Kenchikubutsu: Simple polygon with stroke</Title>
<FeatureTypeStyle>
 <Rule>
  <MaxScaleDenominator>5000</MaxScaleDenominator>
   <PolygonSymbolizer>
---
<Fill>
 <CssParameter name="fill">#CCCCCC</CssParameter>
</Fill>
<Stroke>
 <CssParameter name="stroke">#666666</CssParameter>
 <CssParameter name="stroke-width">1</CssParameter>
</Stroke>
---

それぞれのレイヤに設定します。
自然公園 

特別地域

町字界線

町字界点

建築物

2015年7月29日水曜日

16 - 地図を重ねる 3 - 東京都のスタイル

16-2 東京都のデータの準備
東京都のレイヤ tokyou_kuiki のスタイルを変更します。

16-2-1 東京都(行政区域用)のスタイルを設定
行政区画用のスタイル kukaku をコピーして、行政区域(東京)用のスタイル kuiki を設定しました。

1 左側の欄の「データ」の「スタイル」をクリックします。


2 「スタイル」の「新規スタイル追加」をクリックします。


3 「新規スタイル」で次のように入力します。

ユーザ名: kuiki
ワークスペース: npn
Format: SLD(変更なし)


4 「既存のスタイルをコピーしています」で「npn:kukaku」を選択し「コピーしています」をクリックます。
SLD を入力する欄に「kukaku」の内容が表示されます。


5 内容を次のように変更します。

---
<Title>Kuiki: Simple polygon with stroke</Title>
---
<Fill>
 <CssParameter name="fill">#CCFFCC</CssParameter>
</Fill>
---

6 ページ下の「検証」ボタンをクリックします。


問題なければページ上部に次のように表示されます。


7 ページ下の「送信」ボタンをクリックします。
kuiki が追加されました。


16-2-2 東京都(行政区域用)のスタイルの適用
1 左側の欄の「データ」の「レイヤ」をクリックします。


2 「tokyo_kuiki」をクリックします。


3 ページ上部の「公開」タブをクリックします。

4 「WMS設定」の「デフォルトスタイル」で「npn:kiki」を選択し、「保存」ボタンをクリックします。


16-2-3 東京都(行政区域用)のスタイルの確認
1 左側の欄の「データ」の「レイヤプレビュー」をクリックします。


2 「tokyo_kuiki」を検索し、「共通フォーマット」列の「OpenLayers」をクリックします。


3 成功すれば、OpenLayers Map がポリゴンで表示されます。

16 - 地図を重ねる 2 - あきる野市のスタイル

16-1-2 あきる野市(行政区画用)のスタイルを設定
行政区画用のスタイルを設定します。
1 GeoServer の

GeoServer 2.7.x User Manual
http://docs.geoserver.org/stable/en/user/index.html

の「Styling」をクリックします。

2 Styling
http://docs.geoserver.org/stable/en/user/styling/index.html

の「SLD Cookbook」の「Polygons」をクリックします。

3 Polygons
http://docs.geoserver.org/stable/en/user/styling/sld-cookbook/polygons.html

の「Simple polygon with stroke」を参考にします。

4「CODE」の「View and download the full "Simple polygon with stroke" SLD」をクリックします。
「Simple polygon with stroke」の内容が表示されます。このまま開いたままにするか、別にコピーしておきます。

5 左側の欄の「データ」の「スタイル」をクリックします。


6 「スタイル」の「新規スタイル追加」をクリックします。


7 「新規スタイル」で次のように入力します。

ユーザ名: kukaku
ワークスペース: npn
Format: SLD(変更なし)


8 SLD を入力する欄に「Simple polygon with stroke」の内容をコピーして貼り付けます。

9 内容を次のように変更します。
<?xml version="1.0" encoding="UTF-8"?>
<StyledLayerDescriptor version="1.0.0"
 xsi:schemaLocation="http://www.opengis.net/sld StyledLayerDescriptor.xsd"
 xmlns="http://www.opengis.net/sld"
 xmlns:ogc="http://www.opengis.net/ogc"
 xmlns:xlink="http://www.w3.org/1999/xlink"
 xmlns:xsi="http://www.w3.org/2001/XMLSchema-instance">
---
<Title>Kukaku: Simple polygon with stroke</Title>
---
<Fill>
 <CssParameter name="fill">#FFFFCC</CssParameter>
</Fill>
<Stroke>
 <CssParameter name="stroke">#CCCCCC</CssParameter>
 <CssParameter name="stroke-width">1</CssParameter>
</Stroke>
---

全体は次のようになります。
<?xml version="1.0" encoding="UTF-8"?>
<StyledLayerDescriptor version="1.0.0"
 xsi:schemaLocation="http://www.opengis.net/sld StyledLayerDescriptor.xsd"
 xmlns="http://www.opengis.net/sld"
 xmlns:ogc="http://www.opengis.net/ogc"
 xmlns:xlink="http://www.w3.org/1999/xlink"
 xmlns:xsi="http://www.w3.org/2001/XMLSchema-instance">
 <NamedLayer>
  <Name>Simple polygon with stroke</Name>
  <UserStyle>
   <Title>SLD Cook Book: Simple polygon with stroke</Title>
   <FeatureTypeStyle>
    <Rule>
     <PolygonSymbolizer>
      <Fill>
       <CssParameter name="fill">#FFFFCC</CssParameter>
      </Fill>
      <Stroke>
       <CssParameter name="stroke">#CCCCCC</CssParameter>
       <CssParameter name="stroke-width">1</CssParameter>
      </Stroke>
     </PolygonSymbolizer>
    </Rule>
   </FeatureTypeStyle>
  </UserStyle>
 </NamedLayer>
</StyledLayerDescriptor>

10 ページ下の「検証」ボタンをクリックします。


問題なければページ上部に次のように表示されます。


11 ページ下の「送信」ボタンをクリックします。
kukaku が追加されました。


16-1-3 あきる野市(行政区画用)のスタイルの適用
1 左側の欄の「データ」の「レイヤ」をクリックします。


2 「akiruno_kukaku-2」をクリックします。


3 ページ上部の「公開」タブをクリックします。

4 「WMS設定」の「デフォルトスタイル」で「npn:kukaku」を選択し、「保存」ボタンをクリックします。


16-1-4 あきる野市(行政区画用)のスタイルの確認
1 左側の欄の「データ」の「レイヤプレビュー」をクリックします。


2 「akiruno_kukaku-2」を検索し、「共通フォーマット」列の「OpenLayers」をクリックします。


3 成功すれば、OpenLayers Map がポリゴンで表示されます。

2015年2月12日木曜日

2 - ol3.2ex 58b - Custom styles for polygons 2

「polygon-styles.js(258-ol3ex.js)」は、マップを表示するための JavaScript ファイルです。

「258-ol3ex.js」
var styles = [
  /* We are using two different styles for the polygons:
   *  - The first style is for the polygons themselves.
   *  - The second style is to draw the vertices of the 
   *    polygons.
   *    In a custom `geometry` function the vertices of a 
   *    polygon are returned as `MultiPoint` geometry, 
   *    which will be used to render the style.
   * 私たちは、ポリゴンのための二つの異なるスタイルを使用していま
   * す:
   * - 最初のスタイルは、ポリゴン自身のためのものです。
   * - 第二のスタイルは、ポリゴンの頂点を描画するためです。
   * `geometry`カスタムファンクションでは、ポリゴンの頂点は、ス
   * タイルを描画するために使用される`MultiPoint`ジオメトリとし
   * て返されます。
   */
 new ol.style.Style({
  /** ol.style.Style 
   * Base class for vector feature rendering styles.
   * ベクタフィーチャがスタイルを描画するための基本クラス。
   * (ol3 API)
   */
  stroke: new ol.style.Stroke({
  /** ol.style.Stroke 
   * Set stroke style for vector features. 
   * Note that the defaults given are the Canvas defaults, 
   * which will be used if option is not defined. 
   * The get functions return whatever was entered 
   * in the options;  they will not return the default.
   * ベクタフィーチャのためのストロークスタイルの設定。
   * デフォルトは、オプションが定義されていない場合に使用される
   * Canvas のデフォルトを与えられることに注意してください。 
   * GET関数は、オプションで入力されたものはすべて返します。
   * それらはデフォルトを返しません。(ol3 API)
   */
   color: 'blue',
   width: 3
  }),
  fill: new ol.style.Fill({
  /** ol.style.Fill 
   * Set fill style for vector features.
   * ベクタフィーチャの塗りつぶしスタイルを設定。(ol3 API)
   */
   color: 'rgba(0, 0, 255, 0.1)'
  })
 }),
 new ol.style.Style({
  image: new ol.style.Circle({
  /** ol.style.Circle
   * Set circle style for vector features.
   * ベクタフィーチャの円のスタイルを設定。(ol3 API)
   */
   radius: 5,
   fill: new ol.style.Fill({
    color: 'orange'
   })
  }),
  geometry: function(feature) {
  // return the coordinates of the first ring of the polygon
  // ポリゴンの最初のリングの座標を返します。
   var coordinates = feature.getGeometry().getCoordinates()[0];
   /** getGeometry()
    *  Returns the Geometry associated with this feature 
    * using the current geometry name property. By default, 
    * this is geometry but it may be changed by calling 
    * setGeometryName.
    * 現在のジオメトリネームプロパティを使用して、このフィーチャに
    * 関連したジオメトリを返します。デフォルトでは、ジオメトリです
    * が、setGeometryName を呼び出すことによって変更することがで
    * きます。(ol3 API)
    */
   /** getCoordinates()
    * Returns: Coordinates.(ol3 API)
    */
    return new ol.geom.MultiPoint(coordinates);
    /** ol.geom.MultiPoint 
     * Multi-point geometry.(ol3 API)
     */
  }
 })
];
var source = new ol.source.GeoJSON(/** @type {olx.source.GeoJSONOptions} */ ({
  /** ol.source.GeoJSON 
   * Static vector source in GeoJSON format
   * GeoJSON フォーマットの静的ベクタソース。(ol3 API)
   */
/** @type 
 * 値のタイプ(型)の説明 - 式などで表示
 * (@use JSDoc[http://usejsdoc.org/]より)
 */
 object: {
  'type': 'FeatureCollection',
  'crs': {
   'type': 'name',
   'properties': {
    'name': 'EPSG:3857'
   }
  },
  'features': [
   {
    'type': 'Feature',
    'geometry': {
     'type': 'Polygon',
     'coordinates': [[[-5e6, 6e6], [-5e6, 8e6], [-3e6, 8e6],
      [-3e6, 6e6], [-5e6, 6e6]]]
    }
   },
   {
    'type': 'Feature',
    'geometry': {
     'type': 'Polygon',
     'coordinates': [[[-2e6, 6e6], [-2e6, 8e6], [0, 8e6],
      [0, 6e6], [-2e6, 6e6]]]
    }
   },
   {
    'type': 'Feature',
    'geometry': {
     'type': 'Polygon',
     'coordinates': [[[1e6, 6e6], [1e6, 8e6], [3e6, 8e6],
      [3e6, 6e6], [1e6, 6e6]]]
    }
   },
   {
    'type': 'Feature',
    'geometry': {
     'type': 'Polygon',
     'coordinates': [[[-2e6, -1e6], [-1e6, 1e6],
      [0, -1e6], [-2e6, -1e6]]]
    }
   }
  ]
 }
}));
var layer = new ol.layer.Vector({
/** ol.layer.Vector
 * Vector data that is rendered client-side.
 * クライアント側で描画されたベクタデータ。(ol3 API)
 */
 source: source,
 style: styles
});
var map = new ol.Map({
 layers: [layer],
 target: 'map',
 view: new ol.View({
  center: [0, 1000000],
  zoom: 2
 })
});

2 - ol3.2ex 58a - Custom styles for polygons 1

「Custom styles for polygons(polygon-styles.html)」を参考に地図を表示してみます。


HTML ファイルの作成
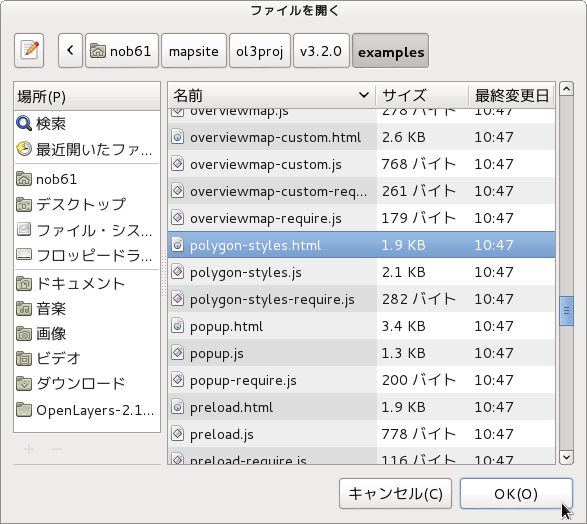
a Eclipse のメニューの「ファイル」->「ファイルを開く」をクリックします。


b 「ファイルを開く」ウィンドウで、「user」->「mapsite」->「ol3proj」->「v3.2.0」->「examples」->「polygon-styles.html」をクリックして選択し、「OK」ボタンをクリックします。
同じように「polygon-styles.js」を開きます。


c メニューの「ファイル」->「新規」 -> 「ファイル」をクリックします。


d 「ファイル」ウィンドウで「ol3proj」をクリックして選択し、「ファイル名」を「258-ol3ex.html」と入力し、「次へ」ボタンをクリックします。


e 「File Template」ウィンドウで「HTML 5 Template」をクリックして選択し、「OK」ボタンをクリックします。


f 「polygon-styles.html」の内容をコピーして「258-ol3ex.html」に貼り付け、修正します。
g 同じように、新規に「258-ol3ex.js」ファイルを作成し、「File Template」ウィンドウで「JavaScript Template」をクリックして選択し、「完了」ボタンをクリックして、「polygon-styles.js」の内容をコピーして貼り付け、修正します。「polygon-styles-require.js」も「258-ol3ex-require.js」に貼り付けます。


「258-ol3ex.html」
<!doctype html>
<html lang="en">
 <head>
  <meta charset="utf-8">
  <meta http-equiv="X-UA-Compatible" content="chrome=1">
  <meta name="viewport" content="initial-scale=1.0, user-scalable=no, width=device-width">
<!--
  <link rel="stylesheet" href="../css/ol.css" type="text/css">
  <link rel="stylesheet" href="../resources/bootstrap/css/bootstrap.min.css" type="text/css">
  <link rel="stylesheet" href="../resources/layout.css" type="text/css">
  <link rel="stylesheet" href="../resources/bootstrap/css/bootstrap-responsive.min.css" type="text/css">
-->
  <!-- ディレクトリ修正 -->
  <link rel="stylesheet" href="v3.2.0/css/ol.css" type="text/css">
  <link rel="stylesheet" href="v3.2.0/resources/bootstrap/css/bootstrap.min.css" type="text/css">
  <link rel="stylesheet" href="v3.2.0/resources/layout.css" type="text/css">
  <link rel="stylesheet" href="v3.2.0/resources/bootstrap/css/bootstrap-responsive.min.css" type="text/css">
  <title>Custom styles for polygons</title>
  <style>
   .map {
    background: grey;
   }
  </style>
 </head>
 <body>
  <!-- 
  bootstrap.min.css, bootstrap-responsive.min.css で設定されたセレクタを使用。
  -->
  <div class="navbar navbar-inverse navbar-fixed-top">
   <div class="navbar-inner">
    <div class="container">
     <!--
     <a class="brand" href="./"><img src="../resources/logo.png"> OpenLayers 3 Examples</a>
     -->
      <!-- ディレクトリ修正 -->
     <a class="brand" href="v3.2.0/examples/"><img src="v3.2.0/resources/logo.png"> OpenLayers 3 Examples</a>
    </div>
   </div>
  </div>
  <div class="container-fluid">
   <div class="row-fluid">
    <div class="span12">
     <div id="map" class="map"></div>
    </div>
   </div>
   <div class="row-fluid">
    <div class="span12">
     <h4 id="title">Custom styles for polygons</h4>
     <p id="shortdesc">Showing the vertices of a polygon 
      with a custom style geometry.</p>
     <div id="docs">
      <!--
      See the <a href="polygon-styles.js" target="_blank">polygon-styles.js source</a> to see how this is done.</p>
      -->
      <!-- ファイル修正 -->
      See the <a href="258-ol3ex.js" target="_blank">258-ol3ex.js source</a> to see how this is done.</p>
     </div>
     <div id="tags">polygon, vector, style, GeometryFunction</div>
    </div>
   </div>
  </div>
  <!--
  <script src="../resources/jquery.min.js" type="text/javascript"></script>
  <script src="../resources/example-behaviour.js" type="text/javascript"></script>
  -->
  <!-- ディレクトリ修正
   jQuery Minified版と
   example-behaviour.js(Examples用 JSコード[文字コードなど])
  -->
  <script src="v3.2.0/resources/jquery.min.js" type="text/javascript"></script>
  <script src="v3.2.0/resources/example-behaviour.js" type="text/javascript"></script>
  <!--
  <script src="loader.js?id=polygon-styles" type="text/javascript"></script>
  -->
  <!-- ファイル修正 -->  <!-- ディレクトリ修正 -->
  <script src="loader.js?id=258-ol3ex" type="text/javascript"></script>
 </body>
</html>