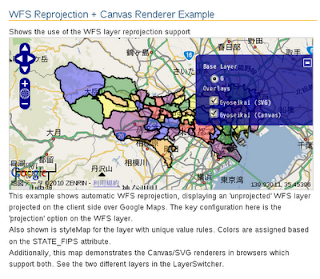
ここの例では、さらに unique value rules を使った styleMap を設定しています。
また、Canvas と SVG 両方をサポートしたブラウザでマップを表示しています。
Canvas は、Mozilla Developer Center (MDC) の
「Canvas チュートリアル」
https://developer.mozilla.org/ja/Canvas_tutorial
に「スクリプト(一般的に JavaScript)を使って図形を描くために使われる新しい HTML 要素です。」とあります。
SVG は、MDC の
「Mozilla SVG Project」
https://developer.mozilla.org/ja/Mozilla_SVG_Project
に「Scalable Vector Graphics のことであり、それが高度な 2 次元グラフィックのための XML 言語である」とあります。
FIPS (Federal Information Processing Standard) state コードは、アメリカ合衆国の50州につけられたアルファベット2文字のコードと2桁の数字コードです。
今回は、行政コードを使用します。
HTML ファイルを新規作成します。
「openlayersTokyoproj」 を右クリックして 新規 -> HTML ファイル をクリック。
「HTML ファイル」ウィンドウの「ファイル名(任意:openlayers_wfsreprojection.html)」に入力して「完了」ボタンをクリック。
「charset」を「utf-8」にします。
「examples」の「wfs-reprojection.html」の内容をコピーして新規作成したファイルに貼り付けます。
コードの修正とちょっと解説します。
<html xmlns="http://www.w3.org/1999/xhtml">
 <head>
  <meta http-equiv="Content-Type" content="text/html; charset=utf-8">
  <title>OpenLayers53 WFS Reprojection + Canvas Renderer</title>

<!-- スタイルシート -->
  <link rel="stylesheet" href="./theme/default/style.css" type="text/css" />
  <link rel="stylesheet" href="./examples/style.css" type="text/css" />

<!-- OpenLayers ライブラリ -->
  <script src="./lib/Firebug/firebug.js"></script>
  <script src="./lib/OpenLayers.js"></script>

<!-- Proj4js ライブラリ -->
  <script type="text/javascript" src="./lib/proj4js/lib/proj4js-compressed.js"></script>
  <script type="text/javascript" src="./lib/proj4js/lib/projCode/tmerc.js"></script>
  <script type="text/javascript" src="./lib/proj4js/lib/defs/EPSG2456.js"></script>

<!-- Google Map API キー -->
  <script src="http://maps.google.com/maps?file=api&v=2&key=ABQIA...(以下省略)" type="text/javascript"></script>
  <script type="text/javascript">

   var map, layer, styleMap;
   OpenLayers.ProxyHost= "/cgi-bin/proxy.cgi?url="; // 修正
   function init(){
// 東京都用 map の設定
    map = new OpenLayers.Map('map', {
     projection: new OpenLayers.Projection("EPSG:900913"),
     displayProjection: new OpenLayers.Projection("EPSG:4326"),
     units: "m",
     maxResolution: 156543.0339,
// インストールした Proj4js で 東京都の範囲に変更
     maxExtent: new OpenLayers.Bounds(15465203, 4227761, 15579121, 4292512)
    });
    var g = new OpenLayers.Layer.Google("G", {sphericalMercator: true});
    map.addLayers([g]);

    // prepare to style the data
    styleMap = new OpenLayers.StyleMap({
     strokeColor: "black",
     strokeWidth: 2,
     strokeOpacity: 0.5,
     fillOpacity: 0.2
    });
    // create a color table for aac(state FIPS) code
    var colors = ["red", "orange", "yellow", "green", "blue", "purple"];
    var code, gyo_aac = {}; // 'gyo_aac' に修正
    for(var i=1; i<=320; ++i) { // Tokyo aac 13101 -> 13421
     code = 13100 + i;
     gyo_aac[code] = {fillColor: colors[i % colors.length]}; // 'gyo_aac' に修正
    }
    // add unique value rules with your color lookup
    styleMap.addUniqueValueRules("default", "aac", gyo_aac); // 'gyo_aac' に修正
    // create a wfs layer with a projection different than the map
    // (only if your wfs doens't support your map projection)
    var wfs = layer = new OpenLayers.Layer.WFS(
     "Gyoseikai (SVG)", // 修正
     "http://localhost:8080/geoserver/ows", // 修正
     {typename: 'sde:gyoseikai'}, // 修正
     {
      typename: 'gyoseikai', // 修正
      featureNS: 'http://geoserver.sf.net', // 修正
      projection: new OpenLayers.Projection("EPSG:4326"),
      extractAttributes: true,
      ratio: 1.2,
      styleMap: styleMap
     }
    );
    map.addLayer(wfs);

    var wfs = layer = new OpenLayers.Layer.WFS(
     "Gyoseikai (Canvas)", // 修正
     "http://localhost:8080/geoserver/ows", // 修正
     {typename: 'sde:gyoseikai'}, // 修正
     {
      typename: 'gyoseikai', // 修正
      featureNS: 'http://geoserver.sf.netp', // 修正
      projection: new OpenLayers.Projection("EPSG:4326"),
      extractAttributes: true,
      ratio: 1.2,
      styleMap: styleMap,
      renderers: ['Canvas', 'SVG', 'VML']
     }
    );
    map.addLayer(wfs);
    map.addControl(new OpenLayers.Control.LayerSwitcher());
    map.addControl(new OpenLayers.Control.MousePosition()); // 追加
    map.addControl(new OpenLayers.Control.ScaleLine());     // 追加

    // if you want to use Geographic coords, transform to ESPG:900913
    var ddBounds = new OpenLayers.Bounds(138.926, 35.468, 139.949, 35.941); // 修正
    map.zoomToExtent(
     ddBounds.transform(map.displayProjection, map.getProjectionObject())
    );
   }
  </script>
 </head>
 <body onload="init()">
  <h1 id="title">WFS Reprojection + Canvas Renderer Example</h1>
  <div id="tags"></div>
  <p id="shortdesc">
   Shows the use of the WFS layer reprojection support
  </p>
  <div id="map" class="smallmap"></div>
  <div id="docs">
   <p>This example shows automatic WFS reprojection, displaying an 'unprojected'
    WFS layer projected on the client side over Google Maps. The key configuration
    here is the 'projection' option on the WFS layer.</p>
   <p>Also shown is styleMap for the layer with unique value rules.  Colors
    are assigned based on the STATE_FIPS attribute.</p>
   <p>Additionally, this map demonstrates the Canvas/SVG renderers in browsers
    which support both. See the two different layers in the LayerSwitcher.</p>
  </div>
 </body>
</html>


0 件のコメント:
コメントを投稿