http://www.geoext.org/tutorials/quickstart.html
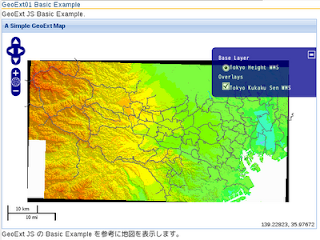
の Basic Example を地図を表示します。
GeoExt の 基本となる GeoExt.MapPanel を使用してデータを描画します。
HTML ファイルを新規作成します。
「openlayersTokyoproj」 を右クリックして 新規 -> HTML ファイル をクリック。
「HTML ファイル」ウィンドウの「ファイル名(任意:geoext01_basic-ex.html)」に入力して「完了」ボタンをクリック。
「charset」を「utf-8」にします。
GeoExt QuickStart サイトの Basic Example を参考に以下のように HTML を作成します。
(以前使用した WMS レイヤです。)
<html>
 <head>
  <meta http-equiv="Content-Type" content="text/html; charset=utf-8">
   <title>GeoExt01 Basic Example</title>
   <link rel="stylesheet" href="./theme/default/style.css" type="text/css" />
   <link rel="stylesheet" href="./examples/style.css" type="text/css" />

   <script src="./lib/Firebug/firebug.js"></script>
<!-- 修正 -->
   <script src="./OpenLayers-2.10/lib/OpenLayers.js"></script>

   <script type="text/javascript" src="./lib/proj4js/lib/proj4js-compressed.js"></script>
   <script type="text/javascript" src="./lib/proj4js/lib/projCode/tmerc.js"></script>
   <script type="text/javascript" src="./lib/proj4js/lib/defs/EPSG2456.js"></script>
<!-- Ext JS、GeoExt 追加 -->
   <script src="./ext-3.2.1/adapter/ext/ext-base.js" type="text/javascript"></script>
   <script src="./ext-3.2.1/ext-all.js"  type="text/javascript"></script>
   <link rel="stylesheet" type="text/css" href="./ext-3.2.1/resources/css/ext-all.css"></link> <!-- 修正 -->
<!--
   <script src="OpenLayers/OpenLayers.js" type="text/javascript"></script>
 -->
   <script src="./GeoExt/lib/GeoExt.js" type="text/javascript"></script>
   <link rel="stylesheet" type="text/css" href="./GeoExt/resources/css/geoext-all-debug.css"></link> <!-- 修正 -->
   <script type="text/javascript">
    var map, layer1, layer2;

    Ext.onReady(function () { // ドキュメントが準備できたとき実行
     map = new OpenLayers.Map('map', {
      projection: new OpenLayers.Projection("EPSG:2456"),
      maxResolution: 'auto',
      maxExtent: new OpenLayers.Bounds(-279000,1054000,-185000,1104000),
      units: 'meters',
      displayProjection: new OpenLayers.Projection("EPSG:4326")
     });

    layer1 = new OpenLayers.Layer.WMS( "Tokyo Height WMS",
      "http://192.168.1.6/cgi-bin/mapserv?",
      {
      map: '/home/nob61/mapfile/tokyo_bmi_pgis_img2.map',
      layers: 'height',
      isBaselayer: true,
      format: 'image/png'
    });

    layer2 = new OpenLayers.Layer.WMS( "Tokyo Kukaku Sen WMS",
     "http://192.168.1.6/cgi-bin/mapserv?",
     {
      map: '/home/nob61/mapfile/tokyo_bmi_pgis_img2.map',
      layers: 'kukaku',
      transparent: true,
      format: 'image/png'
    });

    map.addLayers([layer1, layer2]);
    map.addControl(new OpenLayers.Control.LayerSwitcher());
    map.addControl(new OpenLayers.Control.MousePosition());
    map.addControl(new OpenLayers.Control.ScaleLine());
    map.zoomToMaxExtent();
// マップパネルの表示
    new GeoExt.MapPanel({
     renderTo: 'gxmap', // マップ描画のための id
     height: 400, // パネル高さ
     width: 600, // パネル幅
     map: map, // OpenLayers.Map
     title: 'A Simple GeoExt Map' // パネル上部に表示されるタイトル
    });
   });

  </script>
 </head>
 <body>
  <h1 id="title">GeoExt01 Basic Example</h1>
  <p id="shortdesc">
   GeoExt JS Basic Example.
  </p>

<!-- <div id="map" class="smallmap"></div> -->
   <div id="gxmap"></div><!-- 修正 -->
   <div id="docs">
    <p>GeoExt JS の Basic Example を参考に地図を表示します。</p>
   </div>

 </body>
</html>

MapPanel Tutorial
http://www.geoext.org/tutorials/mappanel-tutorial.html
の Working with the MapPanel ではグリッドの表示についてかかれていますが、上記の例では一番最初のデータはマップになっているのでうまく表示できませんでした。
GML データではできると思います。

0 件のコメント:
コメントを投稿