2015年7月30日木曜日

17 - Proj4js を使用した座標変換

座標変換に以前のバージョンの Proj4js を使用します。

17-1 ダウンロード

Proj4js サイト
http://trac.osgeo.org/proj4js/

の「Starting Points」の「Download」をクリックします。

Download-Proj4js
http://trac.osgeo.org/proj4js/wiki/Download

の「Proj4js 1.1.0」の「​http://download.osgeo.org/proj4js/proj4js-1.1.0.zip」をクリックし、ファイルを保存します。

17-2 インストール
ダウンロードした ​proj4js-1.1.0.zip を解凍します。

nob61@deb8-vmw:~$ cd ダウンロード
nob61@deb8-vmw:~/ダウンロード$ ls
---
proj4js-1.1.0.zip
proj4js-2.3.3.zip
---
nob61@deb8-vmw:~/ダウンロード$ unzip proj4js-1.1.0.zip
nob61@deb8-vmw:~/ダウンロード$ ls
---
proj4js
proj4js-1.1.0.zip
proj4js-2.3.3.zip
---

解凍したフォルダを NetBeans の webmapproj の js フォルダに移動します。

nob61@deb8-vmw:~/ダウンロード$ mv proj4js ../public_html/webmapproj/public_html/

17-3 設定
「index.html」を次のように修正します。
「index.html」
<html>
 <head>
  <title>TODO supply a title</title>
  <meta charset="UTF-8">
  <meta name="viewport" content="width=device-width, initial-scale=1.0">
 </head>

 <body>
  <div>TODO write content</div>
  <div><a href="./proj4js/index.html">Proj4js.html</a></div>
  <div><a href="./13-3_ol3-1.html">13-3_ol3-1.html</a></div>
  <div><a href="./14-7_ol3-1.html">14-7_ol3-1.html</a></div>
  <div><a href="./15-3_ol3-1.html">15-3_ol3-1.html</a></div>
  <div><a href="./16-3_ol3-1.html">16-3_ol3-1.html</a></div>
  <div><a href="./16-4_ol3-1.html">16-4_ol3-1.html</a></div>
  <div><a href="./16-5_ol3-1.html">16-4_ol3-1.html</a></div>
 </body>
</html>


解凍したフォルダの proj4js/lib/def/ に定義ファイルがあるので EPSG:2451 を作成します。

EPSG4302.js を参考にします。
データは、/usr/share/proj のものを使用します。

nob61@deb8-vmw:~/ダウンロード$ cd /usr/share/proj/
nob61@deb8-vmw:/usr/share/proj$ grep -A1 JGD2000 epsg
---
# JGD2000 / Japan Plane Rectangular CS IX
<2451> +proj=tmerc +lat_0=36 +lon_0=139.8333333333333 +k=0.9999 +x_0=0 +y_0=0 +ellps=GRS80 +towgs84=0,0,0,0,0,0,0 +units=m +no_defs  <>

定義ファイルの内容

EPSG2451.js
Proj4js.defs["EPSG:2451"]= "+title= JGD2000 Japan Plane Rectangular CS IX +proj=tmerc +lat_0=36 +lon_0=139.8333333333333 +k=0.9999 +x_0=0 +y_0=0 +ellps=GRS80 +towgs84=0,0,0,0,0,0,0 +units=m +no_defs";

定義ファイルの確認
proj4js/index.html ファイルの内容を修正します。

---
<script src="lib/defs/EPSG900913.js"></script>
<script src="lib/defs/EPSG2451.js"></script><!-- ここを追加 -->

<script type="text/javascript">
---

17-4 確認
このファイルをブラウザで開いて、「source」を「EPSG:2451 - JGD2000 Japan Plane Rectangular CS IX」、「dest」を「EPSG:3875 - Google Mercator」にして変換してみます。

EPSG:2451 -54235, -29388
EPSG:3857 15499432, 4264029


2015年7月29日水曜日

16 - 地図を重ねる 6 - レイヤを操作する

16-5 レイヤを操作する
OpenLayers3 の Examples の Layre Groupe example を参考にして、レイヤのプロパティを操作できるようにします。

1 NetBeans を起動します。


2 「新規ファイル」ボタンをクリック。


3 「新規ファイル」ダイアログで「カテゴリ」を「HTML5」ファイルタイプ」を「HTMLファイル」を選択して「次>」ボタンをクリック。


4 「new HTML ファイル」ダイアログで「ファイル名」を「16-5_ol3-1」と入力して「終了」ボタンをクリック。


「index.html」
<html>
 <head>
  <title>TODO supply a title</title>
  <meta charset="UTF-8">
  <meta name="viewport" content="width=device-width, initial-scale=1.0">
 </head>
 <body>
  <div>TODO write content</div>
  <div><a href="./13-3_ol3-1.html">13-3_ol3-1.html</a></div>
  <div><a href="./14-7_ol3-1.html">14-7_ol3-1.html</a></div>
  <div><a href="./15-3_ol3-1.html">15-3_ol3-1.html</a></div>
  <div><a href="./16-3_ol3-1.html">16-3_ol3-1.html</a></div>
  <div><a href="./16-4_ol3-1.html">16-4_ol3-1.html</a></div>
  <div><a href="./16-5_ol3-1.html">16-5_ol3-1.html</a></div>
 </body>
</html>


「16-5_ol3-1.html」
<!DOCTYPE html>
<html>
<head>
<meta charset="utf-8">
<title>あきる野市地図3 Layer group example</title>
<script src="https://code.jquery.com/jquery-1.11.2.min.js"></script>
<link rel="stylesheet" href="https://maxcdn.bootstrapcdn.com/bootstrap/3.3.5/css/bootstrap.min.css">
<script src="https://maxcdn.bootstrapcdn.com/bootstrap/3.3.5/js/bootstrap.min.js"></script>
<link rel="stylesheet" href="https://cdnjs.cloudflare.com/ajax/libs/ol3/3.7.0/ol.css" type="text/css">
<script src="https://cdnjs.cloudflare.com/ajax/libs/ol3/3.7.0/ol.js"></script>
<style>
#layertree li > span {
  cursor: pointer;
}
</style>
</head>
<body>
<div class="container-fluid">
<div class="row-fluid">
 <div class="span6">
  <div id="map" class="map"></div>
 </div>
 <div id="layertree" class="span6">
  <h5>Click on layer nodes below to change their properties.</h5>
  <ul>
   <li><span>地理院地図 写真 layer</span>
    <fieldset id="layer0">
     <label class="checkbox" for="visible0">
      <input id="visible0" class="visible" type="checkbox"/>visibility
     </label>
     <label>opacity</label>
     <input class="opacity" type="range" min="0" max="1" step="0.01"/>
     <label>hue</label>
     <input class="hue" type="range" min="-3.141592653589793" max="3.141592653589793" step="0.01"/>
     <label>saturation</label>
     <input class="saturation" type="range" min="0" max="5" step="0.01"/>
     <label>contrast</label>
     <input class="contrast" type="range" min="0" max="2" step="0.01"/>
     <label>brightness</label>
     <input class="brightness" type="range" min="-1" max="1" step="0.01"/>
    </fieldset>
   </li>
   <li>
    <span>Layer group</span>
    <fieldset id="layer1">
     <label class="checkbox" for="visible1">
      <input id="visible1" class="visible" type="checkbox"/>visibility
     </label>
     <label>opacity</label>
     <input class="opacity" type="range" min="0" max="1" step="0.01"/>
     <label>hue</label>
     <input class="hue" type="range" min="-3.141592653589793" max="3.141592653589793" step="0.01"/>
     <label>saturation</label>
     <input class="saturation" type="range" min="0" max="5" step="0.01"/>
     <label>contrast</label>
     <input class="contrast" type="range" min="0" max="2" step="0.01"/>
     <label>brightness</label>
     <input class="brightness" type="range" min="-1" max="1" step="0.01"/>
    </fieldset>
    <ul>
     <li>
      <span>東京都 国土数値情報 layer</span>
      <fieldset id="layer10">
       <label class="checkbox" for="visible10">
        <input id="visible10" class="visible" type="checkbox"/>visibility
       </label>
       <label>opacity</label>
       <input class="opacity" type="range" min="0" max="1" step="0.01"/>
       <label>hue</label>
       <input class="hue" type="range" min="-3.141592653589793" max="3.141592653589793" step="0.01"/>
       <label>saturation</label>
       <input class="saturation" type="range" min="0" max="5" step="0.01"/>
       <label>contrast</label>
       <input class="contrast" type="range" min="0" max="2" step="0.01"/>
       <label>brightness</label>
       <input class="brightness" type="range" min="-1" max="1" step="0.01"/>
      </fieldset>
     </li>
     <li>
      <span>あきる野市 基盤地図情報 layer</span>
      <fieldset id="layer11">
       <label class="checkbox" for="visible11">
        <input id="visible11" class="visible" type="checkbox"/>visibility
       </label>
       <label>opacity</label>
       <input class="opacity" type="range" min="0" max="1" step="0.01"/>
       <label>hue</label>
       <input class="hue" type="range" min="-3.141592653589793" max="3.141592653589793" step="0.01"/>
       <label>saturation</label>
       <input class="saturation" type="range" min="0" max="5" step="0.01"/>
       <label>contrast</label>
       <input class="contrast" type="range" min="0" max="2" step="0.01"/>
       <label>brightness</label>
       <input class="brightness" type="range" min="-1" max="1" step="0.01"/>
      </fieldset>
     </li>
    </ul>
   </li>
  </ul>
 </div>
</div>
</div>
<script>
var extent = [15488640, 4257688, 15510235, 4270370];
var map = new ol.Map({
 layers: [
  new ol.layer.Tile({
   extent: extent,
   source: new ol.source.XYZ({
    url: 'http://cyberjapandata.gsi.go.jp/xyz/ort/{z}/{x}/{y}.jpg',
    attributions: [new ol.Attribution({
     html: '<a href="http://www.gsi.go.jp/kikakuchousei/' +
           'kikakuchousei40182.html" target="_blank">' +
             '国土地理院 地理院地図</a>'
    })],
   })
  }),
  new ol.layer.Group({
   layers: [
    new ol.layer.Tile({
     extent: extent,
     source: new ol.source.TileWMS({
      url: 'http://localhost:8080/geoserver/wms',
      attributions: [new ol.Attribution({
       html: '国土数値情報'
      })],
      params: {
       'LAYERS': 'tokyo_kuiki', 
       'SRS': 'EPSG:4326',
       'TILED': true, 
       'VERSION': '1.1.1'
      },
      serverType: 'geoserver',
     })
    }),
    new ol.layer.Tile({
     extent: extent,
     source: new ol.source.TileWMS({
      url: 'http://localhost:8080/geoserver/wms',
      attributions: [new ol.Attribution({
       html: '<a href="http://www.gsi.go.jp/kikakuchousei/' +
             'kikakuchousei40182.html" target="_blank">' +
               '国土地理院 基盤地図情報</a>'
      })],
      params: {
       'LAYERS': 'akiruno_kukaku-2', 
       'SRS': 'EPSG:2451',
       'TILED': true, 
       'VERSION': '1.1.1'
      },
      serverType: 'geoserver',
     })
    })
   ]
  })
 ],
 controls: ol.control.defaults({
  attributionOptions: /** @type {olx.control.AttributionOptions} */ ({
   collapsible: false
  })
 }).extend([
  new ol.control.ScaleLine()
 ]),
 target: 'map',
 view: new ol.View({
  center: [15499432, 4264029],
  extent: extent,
  zoom: 12
 })
});
function bindInputs(layerid, layer) {
 var visibilityInput = $(layerid + ' input.visible');
 visibilityInput.on('change', function() {
  layer.setVisible(this.checked);
 });
 visibilityInput.prop('checked', layer.getVisible());
 $.each(['opacity', 'hue', 'saturation', 'contrast', 'brightness'],
  function(i, v) {
   var input = $(layerid + ' input.' + v);
   input.on('input change', function() {
    layer.set(v, parseFloat(this.value));
   });
   input.val(String(layer.get(v)));
  }
 );
}
map.getLayers().forEach(function(layer, i) {
 bindInputs('#layer' + i, layer);
 if (layer instanceof ol.layer.Group) {
  layer.getLayers().forEach(function(sublayer, j) {
   bindInputs('#layer' + i + j, sublayer);
  });
 }
});
$('#layertree li > span').click(function() {
 $(this).siblings('fieldset').toggle();
}).siblings('fieldset').hide();
</script>
</body>
</html>


16 - 地図を重ねる 5 - 地理院地図と東京都とあきる野市の地図の表示

16-4 地理院地図と東京都とあきる野市の地図の表示
webmapproj プロジェクトに HTML ファイル(16-4_ol3-1.html) を追加します。
1 NetBeans を起動します。


2 「新規ファイル」ボタンをクリック。

3 「新規ファイル」ダイアログで「カテゴリ」を「HTML5」ファイルタイプ」を「HTMLファイル」を選択して「次>」ボタンをクリック。


4 「new HTML ファイル」ダイアログで「ファイル名」を「16-4_ol3-1.html」と入力して「終了」ボタンをクリック。


「index.html」
<html>
 <head>
  <title>TODO supply a title</title>
  <meta charset="UTF-8">
  <meta name="viewport" content="width=device-width, initial-scale=1.0">
 </head>
 <body>
  <div>TODO write content</div>
  <div><a href="./13-3_ol3-1.html">13-3_ol3-1.html</a></div>
  <div><a href="./14-7_ol3-1.html">14-7_ol3-1.html</a></div>
  <div><a href="./15-3_ol3-1.html">15-3_ol3-1.html</a></div>
  <div><a href="./16-3_ol3-1.html">16-3_ol3-1.html</a></div>
  <div><a href="./16-4_ol3-1.html">16-4_ol3-1.html</a></div>
 </body>
</html>


「16-4_ol3-1.html」
<!DOCTYPE html>
<html>
<head>
<meta charset="utf-8">
<title>あきる野市地図2</title>
<script src="https://code.jquery.com/jquery-1.11.2.min.js"></script>
<link rel="stylesheet" href="https://maxcdn.bootstrapcdn.com/bootstrap/3.3.5/css/bootstrap.min.css">
<script src="https://maxcdn.bootstrapcdn.com/bootstrap/3.3.5/js/bootstrap.min.js"></script>
<link rel="stylesheet" href="https://cdnjs.cloudflare.com/ajax/libs/ol3/3.7.0/ol.css" type="text/css">
<script src="https://cdnjs.cloudflare.com/ajax/libs/ol3/3.7.0/ol.js"></script>
<script src="http://cdnjs.cloudflare.com/ajax/libs/proj4js/2.3.6/proj4.js"></script>
<script src="http://epsg.io/2451.js"></script>
</head>
<body>
<div class="container-fluid">
 <div class="row-fluid">
  <div class="span12">
   <div id="map" class="map"></div>
  </div>
 </div>
</div>
<script>
// var extent = [-63041, -34468, -45430, -24309];
var extent = [15488640, 4257688, 15510235, 4270370];
var layers = [
 new ol.layer.Tile({
  extent: extent,
  source: new ol.source.XYZ({
  // attributions: [attribution],
  url: 'http://cyberjapandata.gsi.go.jp/xyz/ort/{z}/{x}/{y}.jpg'
  })
 }),
 new ol.layer.Tile({
  extent: extent,
  opacity: 0.5,
  source: new ol.source.TileWMS({
   url: 'http://localhost:8080/geoserver/wms',
   attributions: [new ol.Attribution({
    html: '国土数値情報'
   })],
   params: {
    'LAYERS': 'tokyo_kuiki', 
    'SRS': 'EPSG:4326',
    'TILED': true, 
    'VERSION': '1.1.1'
   },
   serverType: 'geoserver',
  })
 }),
 new ol.layer.Tile({
  extent: extent,
  opacity: 0.5,
  source: new ol.source.TileWMS({
   url: 'http://localhost:8080/geoserver/wms',
   attributions: [new ol.Attribution({
    html: '<a href="http://www.gsi.go.jp/kikakuchousei/' +
          'kikakuchousei40182.html" target="_blank">' +
            '国土地理院 基盤地図情報</a>'
   })],
   params: {
    'LAYERS': 'akiruno_kukaku-2', 
    'SRS': 'EPSG:2451',
    'TILED': true, 
    'VERSION': '1.1.1'
   },
   serverType: 'geoserver',
  })
 })
];
var map = new ol.Map({
 controls: ol.control.defaults({
  attributionOptions: /** @type {olx.control.AttributionOptions} */ ({
   collapsible: false
  }),
  }).extend([
   new ol.control.ScaleLine()
 ]),
 layers: layers,
 target: 'map',
 view: new ol.View({
  // center: [-54235, -29388],
  center: [15499432, 4264029],
  extent: extent,
  zoom: 12,
 })
});
</script>
</body>
</html>


16 - 地図を重ねる 4 - 東京都とあきる野市の地図の表示

16-3 東京都とあきる野市の地図の表示
webmapproj プロジェクトに HTML ファイル(16-3_ol3-1.html) を追加します。
1 NetBeans を起動します。


2 「新規ファイル」ボタンをクリック。

3 「新規ファイル」ダイアログで「カテゴリ」を「HTML5」ファイルタイプ」を「HTMLファイル」を選択して「次>」ボタンをクリック。


4 「new HTML ファイル」ダイアログで「ファイル名」を「16-3_ol3-1.html」と入力して「終了」ボタンをクリック。


「index.html」
<html>
 <head>
  <title>TODO supply a title</title>
  <meta charset="UTF-8">
  <meta name="viewport" content="width=device-width, initial-scale=1.0">
 </head>
 <body>
  <div>TODO write content</div>
  <div><a href="./13-3_ol3-1.html">13-3_ol3-1.html</a></div>
  <div><a href="./14-7_ol3-1.html">14-7_ol3-1.html</a></div>
  <div><a href="./15-3_ol3-1.html">15-3_ol3-1.html</a></div>
  <div><a href="./16-3_ol3-1.html">16-3_ol3-1.html</a></div>
 </body>
</html>


「16-3_ol3-1.html」
<!DOCTYPE html>
<html>
<head>
<meta charset="utf-8">
<title>あきる野市地図</title>
<script src="https://code.jquery.com/jquery-1.11.2.min.js"></script>
<link rel="stylesheet" href="https://maxcdn.bootstrapcdn.com/bootstrap/3.3.5/css/bootstrap.min.css">
<script src="https://maxcdn.bootstrapcdn.com/bootstrap/3.3.5/js/bootstrap.min.js"></script>
<link rel="stylesheet" href="https://cdnjs.cloudflare.com/ajax/libs/ol3/3.7.0/ol.css" type="text/css">
<script src="https://cdnjs.cloudflare.com/ajax/libs/ol3/3.7.0/ol.js"></script>
<script src="http://cdnjs.cloudflare.com/ajax/libs/proj4js/2.3.6/proj4.js"></script>
<script src="http://epsg.io/2451.js"></script>
</head>
<body>
<div class="container-fluid">
 <div class="row-fluid">
  <div class="span12">
   <div id="map" class="map"></div>
  </div>
 </div>
</div>
<script>
var projection = new ol.proj.Projection({
 code: 'EPSG:2451',
 extent: [-85044.6807, -406697.3730, 96656.4509, -8388.7498]
});
var extent = [-63041, -34468, -45430, -24309];
var layers = [
 new ol.layer.Tile({
  extent: extent,
  source: new ol.source.TileWMS({
   url: 'http://localhost:8080/geoserver/wms',
   attributions: [new ol.Attribution({
    html: '国土数値情報'
   })],
   params: {
    'LAYERS': 'tokyo_kuiki', 
    'SRS': 'EPSG:4326',
    'TILED': true, 
    'VERSION': '1.1.1'
   },
   serverType: 'geoserver',
  })
 }),
 new ol.layer.Tile({
  extent: extent,
  source: new ol.source.TileWMS({
   url: 'http://localhost:8080/geoserver/wms',
   attributions: [new ol.Attribution({
    html: '<a href="http://www.gsi.go.jp/kikakuchousei/' +
          'kikakuchousei40182.html" target="_blank">' +
            '国土地理院 基盤地図情報</a>'
   })],
   params: {
    'LAYERS': 'akiruno_kukaku-2', 
    'TILED': true, 
    'VERSION': '1.1.1'
   },
   serverType: 'geoserver',
  })
 })
];
var map = new ol.Map({
 controls: ol.control.defaults({
  attributionOptions: /** @type {olx.control.AttributionOptions} */ ({
   collapsible: false
  }),
  }).extend([
   new ol.control.ScaleLine()
 ]),
 layers: layers,
 target: 'map',
 view: new ol.View({
  projection: projection,
  center: [-54235, -29388],
  extent: extent,
  zoom: 5,
 })
});
</script>
</body>
</html>


16 - 地図を重ねる 3 - 東京都のスタイル

16-2 東京都のデータの準備
東京都のレイヤ tokyou_kuiki のスタイルを変更します。

16-2-1 東京都(行政区域用)のスタイルを設定
行政区画用のスタイル kukaku をコピーして、行政区域(東京)用のスタイル kuiki を設定しました。

1 左側の欄の「データ」の「スタイル」をクリックします。


2 「スタイル」の「新規スタイル追加」をクリックします。


3 「新規スタイル」で次のように入力します。

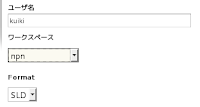
ユーザ名: kuiki
ワークスペース: npn
Format: SLD(変更なし)


4 「既存のスタイルをコピーしています」で「npn:kukaku」を選択し「コピーしています」をクリックます。
SLD を入力する欄に「kukaku」の内容が表示されます。


5 内容を次のように変更します。

---
<Title>Kuiki: Simple polygon with stroke</Title>
---
<Fill>
 <CssParameter name="fill">#CCFFCC</CssParameter>
</Fill>
---

6 ページ下の「検証」ボタンをクリックします。


問題なければページ上部に次のように表示されます。


7 ページ下の「送信」ボタンをクリックします。
kuiki が追加されました。


16-2-2 東京都(行政区域用)のスタイルの適用
1 左側の欄の「データ」の「レイヤ」をクリックします。


2 「tokyo_kuiki」をクリックします。


3 ページ上部の「公開」タブをクリックします。

4 「WMS設定」の「デフォルトスタイル」で「npn:kiki」を選択し、「保存」ボタンをクリックします。


16-2-3 東京都(行政区域用)のスタイルの確認
1 左側の欄の「データ」の「レイヤプレビュー」をクリックします。


2 「tokyo_kuiki」を検索し、「共通フォーマット」列の「OpenLayers」をクリックします。


3 成功すれば、OpenLayers Map がポリゴンで表示されます。

16 - 地図を重ねる 2 - あきる野市のスタイル

16-1-2 あきる野市(行政区画用)のスタイルを設定
行政区画用のスタイルを設定します。
1 GeoServer の

GeoServer 2.7.x User Manual
http://docs.geoserver.org/stable/en/user/index.html

の「Styling」をクリックします。

2 Styling
http://docs.geoserver.org/stable/en/user/styling/index.html

の「SLD Cookbook」の「Polygons」をクリックします。

3 Polygons
http://docs.geoserver.org/stable/en/user/styling/sld-cookbook/polygons.html

の「Simple polygon with stroke」を参考にします。

4「CODE」の「View and download the full "Simple polygon with stroke" SLD」をクリックします。
「Simple polygon with stroke」の内容が表示されます。このまま開いたままにするか、別にコピーしておきます。

5 左側の欄の「データ」の「スタイル」をクリックします。


6 「スタイル」の「新規スタイル追加」をクリックします。


7 「新規スタイル」で次のように入力します。

ユーザ名: kukaku
ワークスペース: npn
Format: SLD(変更なし)


8 SLD を入力する欄に「Simple polygon with stroke」の内容をコピーして貼り付けます。

9 内容を次のように変更します。
<?xml version="1.0" encoding="UTF-8"?>
<StyledLayerDescriptor version="1.0.0"
 xsi:schemaLocation="http://www.opengis.net/sld StyledLayerDescriptor.xsd"
 xmlns="http://www.opengis.net/sld"
 xmlns:ogc="http://www.opengis.net/ogc"
 xmlns:xlink="http://www.w3.org/1999/xlink"
 xmlns:xsi="http://www.w3.org/2001/XMLSchema-instance">
---
<Title>Kukaku: Simple polygon with stroke</Title>
---
<Fill>
 <CssParameter name="fill">#FFFFCC</CssParameter>
</Fill>
<Stroke>
 <CssParameter name="stroke">#CCCCCC</CssParameter>
 <CssParameter name="stroke-width">1</CssParameter>
</Stroke>
---

全体は次のようになります。
<?xml version="1.0" encoding="UTF-8"?>
<StyledLayerDescriptor version="1.0.0"
 xsi:schemaLocation="http://www.opengis.net/sld StyledLayerDescriptor.xsd"
 xmlns="http://www.opengis.net/sld"
 xmlns:ogc="http://www.opengis.net/ogc"
 xmlns:xlink="http://www.w3.org/1999/xlink"
 xmlns:xsi="http://www.w3.org/2001/XMLSchema-instance">
 <NamedLayer>
  <Name>Simple polygon with stroke</Name>
  <UserStyle>
   <Title>SLD Cook Book: Simple polygon with stroke</Title>
   <FeatureTypeStyle>
    <Rule>
     <PolygonSymbolizer>
      <Fill>
       <CssParameter name="fill">#FFFFCC</CssParameter>
      </Fill>
      <Stroke>
       <CssParameter name="stroke">#CCCCCC</CssParameter>
       <CssParameter name="stroke-width">1</CssParameter>
      </Stroke>
     </PolygonSymbolizer>
    </Rule>
   </FeatureTypeStyle>
  </UserStyle>
 </NamedLayer>
</StyledLayerDescriptor>

10 ページ下の「検証」ボタンをクリックします。


問題なければページ上部に次のように表示されます。


11 ページ下の「送信」ボタンをクリックします。
kukaku が追加されました。


16-1-3 あきる野市(行政区画用)のスタイルの適用
1 左側の欄の「データ」の「レイヤ」をクリックします。


2 「akiruno_kukaku-2」をクリックします。


3 ページ上部の「公開」タブをクリックします。

4 「WMS設定」の「デフォルトスタイル」で「npn:kukaku」を選択し、「保存」ボタンをクリックします。


16-1-4 あきる野市(行政区画用)のスタイルの確認
1 左側の欄の「データ」の「レイヤプレビュー」をクリックします。


2 「akiruno_kukaku-2」を検索し、「共通フォーマット」列の「OpenLayers」をクリックします。


3 成功すれば、OpenLayers Map がポリゴンで表示されます。

16 - 地図を重ねる 1 - あきる野市だけのポリゴン

最初に、東京都(国土数値情報)とあきる野市(基盤地図情報)の地図を重ねて、次に、地理院地図(写真)を重ねてみます。

16-1 あきる野市のデータの準備
あきる野市の地図は、あきる野市だけのポリゴンと町字界線のラインを表示します。

16-1-1 あきる野市だけのポリゴン
現在の akiruno_kuiki レイヤは、あきる野市周辺の市町村も表示されます。これをあきる野市だけ表示するようにします。

GeoServer の GeoServer 2.7.x User Manual の

SQL Views
http://docs.geoserver.org/stable/en/user/data/database/sqlview.html

を参考にします。

1 Web ブラウザのアドレスバーに「http://localhost:8080/geoserver」と入力し Enter キーを押して GeoServer を起動します。

2 ユーザ名とパスワードを入力してログインします。

3 左側の欄の「データ」の「レイヤ」をクリックします。


4 「新規レイヤ」の「新規レイヤを追加」の「レイヤ追加元」ドロップダウンから「npn:nlni」を選択します。


5 「SQL ビューを新規作成...」リンクをクリックします。


6 「SQL ビューの新規作成」の「名称を表示」と「SQL ステートメント」を次のように入力します。

名称を表示: akiruno_kukaku-2
SQL ステートメント:
select * from akiruno_kukaku where code = '13228'


7 有効な SQL ステートメントであれば、「属性」の「再読み込み」リンクをクリックすると次のように表示されます。「ユーザ名」の「gid」の「識別子」にチェックをつけてください。


8 「保存」ボタンをクリックします。


9 「レイヤ編集」のページに遷移するので、次のように入力します。

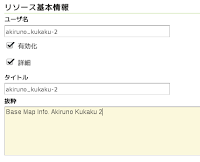
「リソース基本情報」を入力します。
ユーザ名: akiruno_kukaku-2 (変更なし)
有効化: チェック(変更なし)
詳細: チェック(変更なし)
タイトル: Akiruno Kukaku 2(最初の文字を大文字に変更 任意)
抜粋: Base Map Info. Akiruno Kukaku 2 (任意)


「キーワード」を入力します。
(「キーワード」に属性が追加できます。「言語」と「Vocabulary」です。)
現在のキーワード: (追加したキーワードが表示されます)
新しいキーワード: あきる野, 区域(右欄のリストから「日本語」を選択 任意)
語彙集: area(あきる野), category(区域)(任意)(1つずつ入力して「キーワード追加」ボタンをクリック)


「メタデータ・リンク」と「データ・リンク」は変更しません。

「座標参照系(CRS)」を入力します。
元ファイルSRS: 空(変更なし)
指定中のSRS: EPSG:2451 (ogrinfo コマンドで得られた 20141001-AdmArea の情報の 「PROJCS["JGD2000_Japan_Zone_9",」から、「Find」ボタンをクリックして「JGD2000」を検索して表示された「JGD2000 / Japan Plane Rectangular CS IX」をクリック)


SRSのハンドリング: 上書き適用 (変更しない)

「範囲矩形」を入力します。
ネイティブの範囲矩形: (「データを元に算出」をクリック -以下の値が入力されました)
最小X: -63,041.5652649535
最小Y: -34,468.9949383678
最大X: -45,430.3269728472
最大Y: -24,309.7776200733
緯度経度範囲矩形: (「ネイティブの範囲を元に算出」をクリック -以下の値が入力されました)
最小X: 139.1360202890038
最小Y: 35.68729972751299
最大X: 139.33138799969294
最大Y: 35.77983621695984


「Curved geometries control」は変更しません。

「保存」ボタンをクリックします。