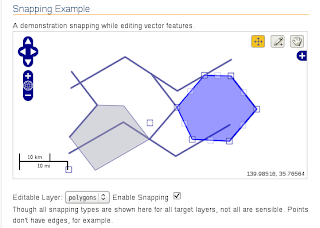
HTML ファイルを新規作成します。
「openlayersTokyoproj」 を右クリックして 新規 -> HTML ファイル をクリック。
「HTML ファイル」ウィンドウの「ファイル名(任意:openlayers_snapping.html)」に入力して「完了」ボタンをクリック。
「charset」を「utf-8」にします。
「examples」の「snapping.html」の内容をコピーして新規作成したファイルに貼り付けます。
コードの修正とちょっと解説します。
(Snapping の "node", "vertex", "edge" の設定がよく分からないので、この部分を省略したコードです。)
<html xmlns="http://www.w3.org/1999/xhtml">
 <head>
  <title>OpenLayers27 Snapping</title>
   <link rel="stylesheet" href="./theme/default/style.css" type="text/css" />
  <link rel="stylesheet" href="./examples/style.css" type="text/css" />

<!-- 編集ボタンのスタイル -->
  <style type="text/css">
   .olControlEditingToolbar .olControlModifyFeatureItemInactive {
    background-position: -1px 0px;
   }
   .olControlEditingToolbar .olControlModifyFeatureItemActive {
    background-position: -1px -23px;
   }
  </style>

<!-- OpenLayers ライブラリ -->
  <script src="./lib/Firebug/firebug.js"></script>
  <script src="./lib/OpenLayers.js"></script>

<!-- Proj4js ライブラリ -->
  <script type="text/javascript" src="./lib/proj4js/lib/proj4js-compressed.js"></script>
  <script type="text/javascript" src="./lib/proj4js/lib/projCode/tmerc.js"></script>
  <script type="text/javascript" src="./lib/proj4js/lib/defs/EPSG2456.js"></script>
<!-- Snapping コード -->
  <script type="text/javascript">
   OpenLayers.Feature.Vector.style['default']['strokeWidth'] = '2';

   function init() {
    initMap();
    initUI();
   }

   var map, draw, modify, snap, point, line, poly;
    function initMap() {

//  map = new OpenLayers.Map('map');
// 東京都用 map の設定
    map = new OpenLayers.Map('map', {
     projection: new OpenLayers.Projection("EPSG:2456"),
     displayProjection: new OpenLayers.Projection("EPSG:4326"),
     maxResolution: 'auto',
     units: 'meters',
     maxExtent: new OpenLayers.Bounds(-279000,1054000,-185000,1104000)
    });
// スタイル(通常、選択、編集中)の設定
   var styles = new OpenLayers.StyleMap({
    "default": new OpenLayers.Style(null, {
     rules: [
      new OpenLayers.Rule({
       symbolizer: {
        "Point": {
         pointRadius: 5,
         graphicName: "square",
         fillColor: "white",
         fillOpacity: 0.25,
         strokeWidth: 1,
         strokeOpacity: 1,
         strokeColor: "#3333aa"
        },
        "Line": {
         strokeWidth: 3,
         strokeOpacity: 1,
         strokeColor: "#6666aa"
        },
        "Polygon": {
         strokeWidth: 1,
         strokeOpacity: 1,
         fillColor: "#9999aa",
         strokeColor: "#6666aa"
        }
       }
      })
     ]
    }),
    "select": new OpenLayers.Style(null, {
     rules: [
      new OpenLayers.Rule({
       symbolizer: {
        "Point": {
         pointRadius: 5,
         graphicName: "square",
         fillColor: "white",
         fillOpacity: 0.25,
         strokeWidth: 2,
         strokeOpacity: 1,
         strokeColor: "#0000ff"
         },
        "Line": {
         strokeWidth: 3,
         strokeOpacity: 1,
         strokeColor: "#0000ff"
         },
        "Polygon": {
         strokeWidth: 2,
         strokeOpacity: 1,
         fillColor: "#0000ff",
         strokeColor: "#0000ff"
         }
        }
       })
      ]
     }),
    "temporary": new OpenLayers.Style(null, {
     rules: [
      new OpenLayers.Rule({
       symbolizer: {
        "Point": {
         graphicName: "square",
         pointRadius: 5,
         fillColor: "white",
         fillOpacity: 0.25,
         strokeWidth: 2,
         strokeColor: "#0000ff"
         },
        "Line": {
         strokeWidth: 3,
         strokeOpacity: 1,
         strokeColor: "#0000ff"
         },
        "Polygon": {
         strokeWidth: 2,
         strokeOpacity: 1,
         strokeColor: "#0000ff",
         fillColor: "#0000ff"
         }
        }
       })
      ]
     })
    });
// create three vector layers
   poly = new OpenLayers.Layer.Vector("polygons", {
    strategies: [new OpenLayers.Strategy.Fixed()],
    protocol: new OpenLayers.Protocol.HTTP({
     url: "ol27_polygon.json", // 修正した東京都の範囲のデータ
     format: new OpenLayers.Format.GeoJSON({ // map の設定に合わせて修正
      internalProjection: new OpenLayers.Projection("EPSG:2456"),
      externalProjection: new OpenLayers.Projection("EPSG:4326")
     }),
    }),
   isBaseLayer: true,
   styleMap: styles
   });
   line = new OpenLayers.Layer.Vector("lines", {
    strategies: [new OpenLayers.Strategy.Fixed()],
    protocol: new OpenLayers.Protocol.HTTP({
     url: "ol27_line.json",
     format: new OpenLayers.Format.GeoJSON({
      internalProjection: new OpenLayers.Projection("EPSG:2456"),
      externalProjection: new OpenLayers.Projection("EPSG:4326")
     }),
    }),
   styleMap: styles
   });
   point = new OpenLayers.Layer.Vector("points", {
    strategies: [new OpenLayers.Strategy.Fixed()],
    protocol: new OpenLayers.Protocol.HTTP({
     url: "ol27_point.json",
     format: new OpenLayers.Format.GeoJSON({
      internalProjection: new OpenLayers.Projection("EPSG:2456"),
      externalProjection: new OpenLayers.Projection("EPSG:4326")
     }),
    }),
    styleMap: styles
    });
   map.addLayers([poly, line, point]);
// configure the snapping agent
   snap = new OpenLayers.Control.Snapping({
    layer: poly,
    targets: [point, line, poly],
    greedy: false
   });
   snap.activate();

   // add some editing tools to a panel
   var panel = new OpenLayers.Control.Panel({
    displayClass: "olControlEditingToolbar"
   });
   draw = new OpenLayers.Control.DrawFeature(
    poly, OpenLayers.Handler.Polygon, {displayClass: "olControlDrawFeaturePoint", title: "Draw Features"}
   );
   modify = new OpenLayers.Control.ModifyFeature(
    poly, {displayClass: "olControlModifyFeature", title: "Modify Features"}
   );
   panel.addControls([
    new OpenLayers.Control.Navigation({title: "Navigate"}),
    draw, modify
   ]);
   map.addControl(panel);
// レイヤスイッチャ、マウスポジション、スケールラインのコントロール設置
   map.addControl(new OpenLayers.Control.LayerSwitcher());
   map.addControl(new OpenLayers.Control.MousePosition());
   map.addControl(new OpenLayers.Control.ScaleLine());

   // give the map a location
// map.setCenter(new OpenLayers.LonLat(0, 0), 1);
   if (!map.getCenter()) {
    map.zoomToMaxExtent()
   };
  }
/**
* Add behavior to page elements. This basically lets us set snapping
* target properties with the checkboxes and text inputs. The checkboxes
* toggle the target node, vertex, or edge (boolean) values. The
* text inputs set the nodeTolerance, vertexTolerance, or edgeTolerance
* property values.
*/
   function initUI() {
    var check = $("snapping");
    check.checked = true;
    check.onclick = function() {
     if(check.checked) {
      snap.activate();
     } else {
      snap.deactivate();
      }
     };

    var sel = $("editable");
    sel.value = "poly";
    sel.onchange = function() {
     updateEditable(sel.value);
     }

   }
// this function allows the editable layer to be changed
// for the snapping control, this amounts to calling setLayer
   function updateEditable(name) {
    layer = window[name];
// update the editable layer for the snapping control (nice)
snap.setLayer(layer);
// update the editable layer for the modify control (ugly)
    var modActive = modify.active;
    if(modActive) {
     modify.deactivate();
     }
    modify.layer = layer;
    modify.selectControl.layer = layer;
    modify.selectControl.handlers.feature.layer = layer;
    modify.dragControl.layer = layer;
    modify.dragControl.handlers.drag.layer = layer;
    modify.dragControl.handlers.feature.layer = layer;
    if(modActive) {
     modify.activate();
     }

   // update the editable layer for the draw control (very ugly)
    var drawActive = draw.active;
    if(drawActive) {
     draw.deactivate();
     }
    draw.layer = layer;
    var handler = ({
     point: OpenLayers.Handler.Point,
     line: OpenLayers.Handler.Path,
     poly: OpenLayers.Handler.Polygon
    })[name];
    draw.handler = new handler(draw, draw.callbacks, draw.handlerOptions);
    if(drawActive) {
     draw.activate();
     }

    }
  </script>
  </head>
<!-- body 部分 -->
  <body onload="init()">
    <h1 id="title">Snapping Example</h1>
    <div id="shortdesc">A demonstration snapping while editing vector features.</div>
    <div id="map" class="smallmap"></div>
    <br/>
    <label for="editable">Editable Layer:</label>
    <select id="editable" name="editable">
     <option value="poly">polygons</option>
     <option value="line">lines</option>
     <option value="point">points</option>
    </select>
    <label for="snapping">Enable Snapping</label>
    <input type="checkbox" name="snapping" id="snapping" checked="checked" />

    <p>Though all snapping types are shown here for all target layers, not all are sensible.
    Points don't have edges, for example.</p>
  </body>
</html>


0 件のコメント:
コメントを投稿