2009年11月30日月曜日

OpenLayers 35a タイルキャッシュの表示 - TileCache

OpenLayers Tile Cache Example(tilecache.html)を参考に タイルキャッシュを表示しようとしましたができなかったので、TileCache で地図を表示することを試してみました。

TileCache ホームページ
http://tilecache.org/

を参考に TileCache 使ってみました。
TileCache は OpenLayers と一緒に使うように設計され、地図のタイル画像を保存し、WMS サーバと同様の動作をします。
TileCache は Python CGI スクリプトで動作し、MetaCarta によって BSD ライセンスで配布されています。

Getting Started
http://tilecache.org/docs/README

に沿って設定してみます。

インストール
Debian では、Synaptic パッケージマネージャでインストールします。
「tilecache」で検索してください。

CGI で操作する
Debian ではこのままで動作しますが、使い方を一通りみてみます。

/etc/tilecache.cfg に タイルをキャッシュ(蓄積)する DiskCache の場所やマップファイルまたは WMS サーバのレイヤのキャッシュの場所を指定します。
今は何もしません。

TileCache ディレクトリで CGI を実行できるように設定します。
Debian では、/usr/lib/cgi-bin になります。

次のアドレスを Web ブラウザに入力します。

http://localhost/cgi-bin/tilecache.cgi?LAYERS=basic&SERVICE=WMS &VERSION=1.1.1&REQUEST=GetMap&SRS=EPSG:4326&BBOX=-180,-90,0,90 &WIDTH=256&HEIGHT=256

または

http://localhost/cgi-bin/tilecache.cgi/1.0.0/basic/0/0/0.png

次の画像が表示されれば設定が完了しています。
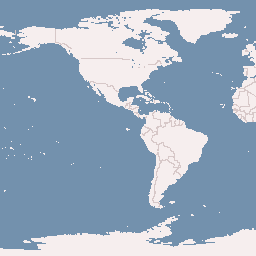


画像表示後に tilecache.cfg で設定した場所にキャッシュ(画像)が保存されます。

---
[cache]
type=Disk
base=/tmp/tilecache
---

次のように保存されていました。

user@debian:~$ ls /tmp/tilecache/basic/00/000/000/000/000/000/000.png

実際に設定してみました。
/etc/tilecache.cfg につぎのように追加します。

---
[kukaku]
type=WMSLayer
mapfile=/home/user/mapfile/tokyo_pgis.map
url=http://192.168.1.6/cgi-bin/mapserv
layers=kukaku
bbox=-279000,1054000,-185000,1104000
srs=EPSG:2456
---

次のアドレスを Web ブラウザに入力します。

http://localhost/cgi-bin/tilecache.cgi?LAYERS=kukaku&SERVICE=WMS &VERSION=1.1.1&REQUEST=GetMap&SRS=EPSG:2456&BBOX=-279000,1054000,-185000,1104000 &WIDTH=256&HEIGHT=256

エラー1: 次のようなエラーが表示されたので、'mapfile' の行をコメントアウトしました。

An error occurred: __init__() got an unexpected keyword argument 'mapfile'

エラー2: 次のようなエラーが表示されたので、'resolutions' の行を追加しました。

An error occurred: can't find resolution index for 367.187500. Available resolutions are:
[183.59375,...


---
resolutions=367.187500,183.593750,91.796875,45.898438,22.949219,11.474609,5.737305,2.868652,1.434326,0.717163,0.358582,0.179291
---

((-185000 - (-279000))/256 = 367.1875 のことです。なぜ経度(X 方向)なのかは分かりません。)

エラー3: 次のようなエラーが表示されたので、'url' の行を修正しました。

An error occurred: Did not get image data back.
URL: http://localhost/cgi-bin/mapserv?layers=kukaku&styles=&service=WMS&width=256&format=image%2Fpng&request=GetMap&height=256&srs=EPSG%3A2456&version=1.1.1&bbox=-279000.0%2C1054000.0%2C-185000.0%2C1148000.0
Content-Type Header: text/html
Response:
<HTML>
<HEAD><TITLE>MapServer Message</TITLE></HEAD>
<!-- MapServer version 5.0.3 OUTPUT=GIF ...
<BODY BGCOLOR="#FFFFFF">
loadMap(): Web application error. CGI variable "map" is not set.
---


---
url=http://localhost/cgi-bin/mapserv?map=/home/user/mapfile/tokyo_bmi_pgis_img.map
---

エラー4? 何も表示されない画像(キャッシュ)が生成されました。
あらかじめ作成しておいた tilecache 用のコードを Webブラウザ(Firefox- Eclipse のプレビュー(デフォルトタブ)では表示されません)で表示させましたが、やはり何も表示されません。
拡大ボタン + をクリックしたら地図が表示されました。

それで、つぎのようにコードを修正したら表示できるようになりました。

---
map = new OpenLayers.Map( $('map'), {
projection: new OpenLayers.Projection("EPSG:2456"),
displayProjection: new OpenLayers.Projection("EPSG:4326"),
// maxResolution: 'auto',
resolutions: [
183.593750,91.796875,45.898438,22.949219,11.474609,5.737305,2.868652,1.434326,0.717163,0.358582,0.179291
],
units: 'meters',
maxExtent: new OpenLayers.Bounds(-279000,1054000,-185000,1104000)
});
---


tilecache.cfg の設定

---
[kukaku]
type=WMS
url=http://192.168.1.6/cgi-bin/mapserv?map=/home/user/mapfile/tokyo_bmi_pgis_img.map
layers=kukaku
bbox=-279000,1054000,-185000,1104000
srs=EPSG:2456
resolutions=367.187500,183.593750,91.796875,45.898438,22.949219,11.474609,5.737305,2.868652,1.434326,0.717163,0.358582,0.179291
---

tilecache 用のコードを作成します。(OpenLayers.Layer.WMS を使用する方法)
HTML ファイルを新規作成します。
「openlayersTokyoproj」 を右クリックして 新規 -> HTML ファイル をクリック。
「HTML ファイル」ウィンドウの「ファイル名(任意:openlayers_tilecache.html)」に入力して「完了」ボタンをクリック。
「charset」を「utf-8」にします。
「/usr/share/doc/tilecache/examples/cgi-example.html」を Eclipse にインポートし、開いて内容をコピーして新規作成したファイルに貼り付けます。

コードの修正とちょっと解説します。

<html xmlns="http://www.w3.org/1999/xhtml">
<head>
<meta http-equiv="Content-Type" content="text/html; charset=utf-8">
<title>OpenLayers35 TileCache</title>
<link rel="stylesheet" href="./theme/default/style.css" type="text/css" />
<link rel="stylesheet" href="./examples/style.css" type="text/css" />

<!-- OpenLayers ライブラリ -->
<script src="./lib/Firebug/firebug.js"></script>
<script src="./lib/OpenLayers.js"></script>

<!-- Proj4js ライブラリ -->
<script type="text/javascript" src="./lib/proj4js/lib/proj4js-compressed.js"></script>
<script type="text/javascript" src="./lib/proj4js/lib/projCode/tmerc.js"></script>
<script type="text/javascript" src="./lib/proj4js/lib/defs/EPSG2456.js"></script>

<!-- Split Feature コード -->

<script type="text/javascript">
var map, layer;
function init(){
// 東京都用 map の設定
map = new OpenLayers.Map( $('map'), {
projection: new OpenLayers.Projection("EPSG:2456"),
displayProjection: new OpenLayers.Projection("EPSG:4326"),
resolutions: [ // tilecache.cfg と同じ設定値
183.593750,91.796875,45.898438,22.949219,11.474609,5.737305,2.868652,1.434326,0.717163,0.358582,0.179291
],
units: 'meters',
maxExtent: new OpenLayers.Bounds(-279000,1054000,-185000,1104000)  // tilecache.cfg と同じ設定値
});
// ここまで
// 東京都区画レイヤ
layer = new OpenLayers.Layer.WMS( "BMI Kukaku",
"/cgi-bin/tilecache.cgi?",
{
layers: 'kukaku',
format: 'image/png'
// serverResolutions: [ 367.187500,183.593750,...] 削除
}
);
map.addLayer(layer);
// map.setCenter(new OpenLayers.LonLat(0, 0), 0);
if (!map.getCenter()) map.zoomToMaxExtent();
map.addControl(new OpenLayers.Control.LayerSwitcher()); // 追加
map.addControl(new OpenLayers.Control.MousePosition()); // 追加
map.addControl(new OpenLayers.Control.ScaleLine()); // 追加
// ここまで
} End of init()

OpenLayers.Util.onImageLoadError = function() {

/**
* For images that don't exist in the cache, you can display
* a default image - one that looks like water for example.
* To show nothing at all, leave the following lines commented out.
*/

//this.src = "../img/blank.gif";
//this.style.display = "";
};
</script>
</head>
<!-- body 部分 -->
<body onload="init()">
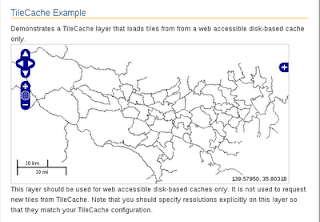
<h1 id="title">TileCache Example</h1>
<div id="tags"></div>
<p id="shortdesc">
Demonstrates a TileCache layer that loads tiles from from a web
accessible disk-based cache only.
</p>
<div id="map" class="smallmap"></div>
<div id="docs">
This layer should be used for web accessible disk-based caches only. It is not used to request new tiles from TileCache. Note that you should specify resolutions explicitly on this layer so that they match your TileCache configuration.
</div>
</body>
</html>

2009年11月29日日曜日

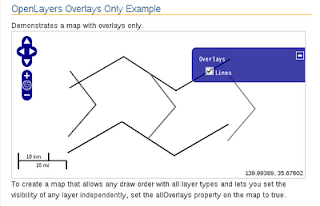
OpenLayers 34 すべてオーバレイの表示 - AllOberLays

OpenLayers Overlays Only Example(all-overlays.html)を参考に ベースマップのない地図の表示します。

HTML ファイルを新規作成します。
「openlayersTokyoproj」 を右クリックして 新規 -> HTML ファイル をクリック。
「HTML ファイル」ウィンドウの「ファイル名(任意:openlayers_all-overlays.html)」に入力して「完了」ボタンをクリック。
「charset」を「utf-8」にします。
「examples」の「all-overlays.html」の内容をコピーして新規作成したファイルに貼り付けます。

コードの修正とちょっと解説します。

<html xmlns="http://www.w3.org/1999/xhtml">
<head>
<meta http-equiv="Content-Type" content="text/html; charset=utf-8">
<title>OpenLayers34 All Overlays</title>
<link rel="stylesheet" href="./theme/default/style.css" type="text/css" />
<link rel="stylesheet" href="./examples/style.css" type="text/css" />

<!-- OpenLayers ライブラリ -->
<script src="./lib/Firebug/firebug.js"></script>
<script src="./lib/OpenLayers.js"></script>

<!-- Proj4js ライブラリ -->
<script type="text/javascript" src="./lib/proj4js/lib/proj4js-compressed.js"></script>
<script type="text/javascript" src="./lib/proj4js/lib/projCode/tmerc.js"></script>
<script type="text/javascript" src="./lib/proj4js/lib/defs/EPSG2456.js"></script>

<!-- All Overlay コード -->

<script type="text/javascript">
var map;
function init() {
// 東京都用 map の設定
map = new OpenLayers.Map('map', {
allOverlays: true, // ここ
projection: new OpenLayers.Projection("EPSG:2456"),
displayProjection: new OpenLayers.Projection("EPSG:4326"),
maxResolution: 'auto',
units: 'meters',
maxExtent: new OpenLayers.Bounds(-279000,1054000,-185000,1104000)
});

// ここまで
// give the features some style

var styles = new OpenLayers.StyleMap({
"default": {
strokeWidth: 2
},
"select": {
strokeColor: "#0099cc",
strokeWidth: 4
}
});

// add rules from the above lookup table

styles.addUniqueValueRules("default", "RP_TYPE", {
10: {strokeColor: "#000000", strokeWidth: 2},
12: {strokeColor: "#222222", strokeWidth: 2},
14: {strokeColor: "#444444", strokeWidth: 2},
16: {strokeColor: "#666666", strokeWidth: 2},
18: {strokeColor: "#888888", strokeWidth: 2},
19: {strokeColor: "#666666", strokeWidth: 1}
});

var vectors = new OpenLayers.Layer.Vector("Lines", {
strategies: [new OpenLayers.Strategy.Fixed()],
protocol: new OpenLayers.Protocol.HTTP({
url: "ol27_line2.json", // 修正
format: new OpenLayers.Format.GeoJSON({
internalProjection: new OpenLayers.Projection("EPSG:2456"), // 追加
externalProjection: new OpenLayers.Projection("EPSG:4326") // 追加
})
}),
styleMap: styles
});

map.addLayer(vectors);
map.addControl(new OpenLayers.Control.LayerSwitcher());
map.addControl(new OpenLayers.Control.MousePosition()); // 追加
map.addControl(new OpenLayers.Control.ScaleLine()); // 追加
map.zoomToMaxExtent();

} // End of function init()
</script>
</head>

<!-- body 部分 -->

<body onload="init()">
<h1 id="title">OpenLayers Overlays Only Example</h1>
<p id="shortdesc">
Demonstrates a map with overlays only.
</p>
<div id="map" class="smallmap"></div>
<div id="docs">
To create a map that allows any draw order with all layer types
and lets you set the visibility of any layer independently, set
the allOverlays property on the map to true.
</div>
</body>
</html>

2009年11月28日土曜日

OpenLayers 33b OpenLayers.Layer Properties の Resolutions について

Class Documents より

OpenLayers.Layer
Properties
resolutions {Array}
A list of map resolutions (map units per pixel) in descending order. If this is not set in the layer constructor, it will be set based on other resolution related properties (maxExtent, maxResolution, maxScale, etc.).

地図の解像度(1ピクセルあたりの地図単位)の降順のリストです。このレイヤコンストラクタで設定されていないと、他の関連するプロパティ(maxExtent、maxResolution、maxScaleなど)の解像度に基づいて設定されます。


地図を拡大縮小すれば分かりますが、設定した resolutions でだけ表示されます。
minResolution を設定したときは、これ以下の解像度では表示されません。
maxResolution を設定したときは、これ以上の解像度では表示されません。

この地図では、南北方向の範囲は 1104000-1054000=50000m です。
解像度は、50000m/250pixsel=195.3125 となります。
(実際には、Firebug -> DOM -> layer1 の maxResolution 195.3125 から逆算しました。)


OpenLayers の Spherical Mercator の First Map
http://docs.openlayers.org/library/spherical_mercator.html#first-map

に次のような文章がありました。

This map has a set of assumptions about the maxResolution of the map. Specifically, most spherical mercator maps use an extent of the world from -180 to 180 longitude, and from -85.0511 to 85.0511 latitude. Because the mercator projection stretches to infinity as you approach the poles, a cutoff in the north-south direction is required, and this particular cutoff results in a perfect square of projected meters. As you can see from the maxExtent parameter sent in the constructor of the layer, the coordinates stretch from -20037508.34 to 20037508.34 in each direction.

The maxResolution of the map defaults to fitting this extent into 256 pixels, resulting in a maxResolution of 156543.0339. This is handled internally by the layer, and does not need to be set in the layer options.

この地図は、マップのmaxResolutionについての仮定を設定しています。具体的には、ほとんどの球状のメルカトル図法の地図は、-180から180の経度、-85.0511から85.0511の緯度の世界の範囲を使用しています。メートル投影は、極点に近づくほど無限大に延びます、南北方向に切り取りが必要です、この特定のカットオフは、投影されたメータの完全な平面になります。このようにレイヤのコンストラクタで送信されたmaxExtentパラメータからわかるように、座標はそれぞれの方向に-20037508.34から20037508.34に延ばされます。

地図の maxResolution は、256ピクセル(私の意見ですが、tile[タイル]の一辺だと思います)にこの範囲内に合わせるため初期化します、結果として 156543.0339 の maxResolution になります。これは、レイヤによって内部で処理されて、レイヤのオプションを設定する必要はありません。

2009年11月26日木曜日

OpenLayers 33a ブラウザ名を表示 - Browser Name

OpenLayers Example(browser-name.html)を参考にラベルの表示をします。

HTML ファイルを新規作成します。
「openlayersTokyoproj」 を右クリックして 新規 -> HTML ファイル をクリック。
「HTML ファイル」ウィンドウの「ファイル名(任意:openlayers_browser-name.html)」に入力して「完了」ボタンをクリック。
「charset」を「utf-8」にします。
「examples」の「browser-name.html」の内容をコピーして新規作成したファイルに貼り付けます。

コードの修正とちょっと解説します。

<html xmlns="http://www.w3.org/1999/xhtml">
<head>
<meta http-equiv="Content-Type" content="text/html; charset=utf-8">
<title>OpenLayers33 Browser Name</title>
<link rel="stylesheet" href="./theme/default/style.css" type="text/css" />
<link rel="stylesheet" href="./examples/style.css" type="text/css" />

<!-- OpenLayers ライブラリ -->
<script src="./lib/Firebug/firebug.js"></script>
<script src="./lib/OpenLayers.js"></script>

<!-- Proj4js ライブラリ -->
<script type="text/javascript" src="./lib/proj4js/lib/proj4js-compressed.js"></script>
<script type="text/javascript" src="./lib/proj4js/lib/projCode/tmerc.js"></script>
<script type="text/javascript" src="./lib/proj4js/lib/defs/EPSG2456.js"></script>

<!-- Browser Name のコード -->

<script type="text/javascript">
// making this a global variable so that it is accessible for
// debugging/inspecting in Firebug
var map = null, measureControls, layer1, layer2, layer3;

function init(){
//set title name to include Browser Detection
// this is the only way to test the functionality
// of the getBrowserName() function
//
var header = OpenLayers.Util.getElement("browserHeader");
header.innerHTML = "(browser: ";
var browserCode = OpenLayers.Util.getBrowserName();
switch (browserCode) {
case "opera":
browserName = "Opera";
break;
case "msie":
browserName = "Internet Explorer";
break;
case "safari":
browserName = "Safari";
break;
case "firefox":
browserName = "FireFox";
break;
case "mozilla":
browserName = "Mozilla";
break;
default:
browserName = "detection error"
break;
}
header.innerHTML += browserName + ")";

// 東京都用 map の設定

map = new OpenLayers.Map('map', {
projection: new OpenLayers.Projection("EPSG:2456"),
displayProjection: new OpenLayers.Projection("EPSG:4326"),
maxResolution: 'auto',
units: 'meters',
maxExtent: new OpenLayers.Bounds(-279000,1054000,-185000,1104000)
});

// ここまで
// ここから追加

var options1 = {
resolutions: [195.3125, 97.65625, 48.828125, 24.4140625]
};
layer1 = new OpenLayers.Layer.WMS( "Tokyo Height WMS",
"http://192.168.1.6/cgi-bin/mapserv?",
{
map: '/home/user/mapfile/tokyo_bmi_pgis_img.map',
layers: 'height',
format: 'image/png'
});

var options2 = {
resolutions: [195.3125, 97.65625,]
};
layer2 = new OpenLayers.Layer.WMS( "Tokyo Kukaku Sen WMS",
"http://192.168.1.6/cgi-bin/mapserv?",
{
map: '/home/user/mapfile/tokyo_bmi_pgis_img2.map',
layers: 'kukaku',
transparent: true,
format: 'image/png'
}, options2);

layer3 = new OpenLayers.Layer.WMS( "Tokyo Gyoseikai mlit WMS",
"http://192.168.1.6/cgi-bin/mapserv?",
{
map: '/home/user/mapfile/tokyo_pf_pgis.map',
layers: 'gyoseikai',
transparent: true,
format: 'image/png'
},{
minResolution: 48.828125,
maxResolution: 97.65625
});

map.addLayers([layer1, layer2, layer3]);
// ここまで
map.addControl(new OpenLayers.Control.LayerSwitcher());
map.addControl(new OpenLayers.Control.MousePosition()); // 追加
map.addControl(new OpenLayers.Control.ScaleLine()); // 追加
// map.setCenter(new OpenLayers.LonLat(0, 0), 0);
map.zoomToMaxExtent();
} // End of function init()

<!-- body 部分 -->

</script>
</head>
<body onload="init()">
<h1 id="title" style="display:inline;">Example Showing Browser Name</h1>
<h3 id="browserHeader" style="display:inline;"></h3>
<div id="tags"></div>
<p id="shortdesc">
Demonstrate a simple map that shows the browser name.
</p>
<div id="map" class="smallmap"></div>
<div id="docs"></div>
</body>
</html>

2009年11月25日水曜日

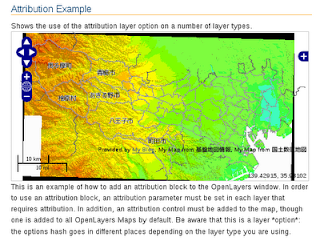
OpenLayers 32 レイヤの属性を表示 - Attribution Example

OpenLayers Attribution Example(attribution.html)を参考にラベルの表示をします。

HTML ファイルを新規作成します。
「openlayersTokyoproj」 を右クリックして 新規 -> HTML ファイル をクリック。
「HTML ファイル」ウィンドウの「ファイル名(任意:openlayers_attribution.html)」に入力して「完了」ボタンをクリック。
「charset」を「utf-8」にします。
「examples」の「Attribution.html」の内容をコピーして新規作成したファイルに貼り付けます。

コードの修正とちょっと解説します。

<html xmlns="http://www.w3.org/1999/xhtml">
<head>
<meta http-equiv="Content-Type" content="text/html; charset=utf-8">
<title>OpenLayers32 Attribution</title>
<link rel="stylesheet" href="./theme/default/style.css" type="text/css" />
<link rel="stylesheet" href="./examples/style.css" type="text/css" />

<!-- OpenLayers ライブラリ -->
<script src="./lib/Firebug/firebug.js"></script>
<script src="./lib/OpenLayers.js"></script>

<!-- Proj4js ライブラリ -->
<script type="text/javascript" src="./lib/proj4js/lib/proj4js-compressed.js"></script>
<script type="text/javascript" src="./lib/proj4js/lib/projCode/tmerc.js"></script>
<script type="text/javascript" src="./lib/proj4js/lib/defs/EPSG2456.js"></script>

<!-- attributions のコード -->

<script type="text/javascript">
var map, measureControls, layer1, layer2, layer3;
function init(){
// map = new OpenLayers.Map('map');
// 東京都用 map の設定
map = new OpenLayers.Map('map', {
projection: new OpenLayers.Projection("EPSG:2456"),
displayProjection: new OpenLayers.Projection("EPSG:4326"),
maxResolution: 'auto',
units: 'meters',
maxExtent: new OpenLayers.Bounds(-279000,1054000,-185000,1104000)
});

// ここまで
// ここから追加

layer1 = new OpenLayers.Layer.WMS( "Tokyo Height WMS",
"http://192.168.1.6/cgi-bin/mapserv?",
{
map: '/home/user/mapfile/tokyo_bmi_pgis_img.map',
layers: 'height',
format: 'image/png'
},{
attribution: 'Provided by <a href="http://nobmob.blogspot.com/2009/11/openlayers-32-attribution.html">My Blog</a>' // 追加
});

layer2 = new OpenLayers.Layer.WMS( "Tokyo Kukaku Sen WMS",
"http://192.168.1.6/cgi-bin/mapserv?",
{
map: '/home/user/mapfile/tokyo_bmi_pgis_img2.map',
layers: 'kukaku',
transparent: true,
format: 'image/png'
},{
attribution:"My Map from 基盤地図情報" // 追加
});

layer3 = new OpenLayers.Layer.WMS( "Tokyo Gyoseikai mlit WMS",
"http://192.168.1.6/cgi-bin/mapserv?",
{
map: '/home/user/mapfile/tokyo_pf_pgis.map',
layers: 'gyoseikai',
transparent: true,
format: 'image/png'
},{
attribution:"My Map from 国土数値地図" // 追加
});

map.addLayers([layer1, layer2, layer3]);

// ここまで

map.addControl(new OpenLayers.Control.LayerSwitcher());
map.addControl(new OpenLayers.Control.Attribution());
map.addControl(new OpenLayers.Control.MousePosition()); // 追加
map.addControl(new OpenLayers.Control.ScaleLine()); // 追加
// map.setCenter(new OpenLayers.LonLat(0, 0), 0);
map.zoomToMaxExtent();
} // End of function init()
</script>
</head>
<body onload="init()">
<h1 id="title">Attribution Example</h1>
<div id="tags">
copyright watermark logo attribution
</div>
<p id="shortdesc">
Shows the use of the attribution layer option on a number of layer types.
</p>
<div id="map" class="smallmap"></div>
<div id="docs">
This is an example of how to add an attribution block to the OpenLayers
window. In order to use an attribution block, an attribution parameter
must be set in each layer that requires attribution. In addition, an
attribution control must be added to the map, though one is added to all
OpenLayers Maps by default.
Be aware that this is a layer *option*: the options hash goes in
different places depending on the layer type you are using.
</div>
</body>
</html>


Attribution の説明の訳

これは、attribution ブロックを OpenLayers のウィンドウに追加する方法の例です。attribution ブロックを使うために、attribution パラメータは、attribution を必要とする各レイヤーに設定する必要があります。加えて、attribution control は、map に追加され、それにより、デフォルトですべての OpenLayers マップに追加されます。
これがレイヤ *オプション* だとということに注意してください。:オプションのハッシュはレイヤの種類に応じて別の場所に入ります。

2009年11月24日火曜日

OpenLayers 31b 距離や面積を計測 - Control.Measure などの説明

Class ドキュメントを抜粋して訳してみました。


■ OpenLayers.Control.Measure
測定のためフィーチャの描画を許可します。

< Properties >

<< handlerOptions >> {Object}
コントロールのハンドラでデフォルトのプロパティ以外を設定するため使用します。

<< persist >> {Boolean}
測定が完了した後、一時的な測定スケッチ描画を保持します。ジオメトリは、新たな計測が開始されるか、コントロールが非アクティブ化されるか、キャンセルが呼ばれるまで保持されます。

< Constants >

<< EVENT_TYPES >> {Array(String)}
サポートされるアプリケーションイベントの種類。次の構文では、特定のイベントたいするリスナーを登録します:

control.events.register(type, obj, listener);

リスナーは、リファレンスでイベントオブジェクトに呼ばれます。このイベントのプロパティは実際に起こったことに依存します。


<<< Supported control event types (in addition to those from OpenLayers.Control) >>>

<<<< measure >>>>
測定スケッチが完了したときにトリガされます。リスナーは、測定、単位、順番、ジオメトリのプロパティのイベントを受信します。

<<<< measurepartial >>>>
新しいポイントが測定スケッチに追加されたときに、トリガされます。リスナーは、測定、単位、順番、ジオメトリとともにイベントを受け取ります。


■ OpenLayers.Handler.Path
地図上にパスを描画するためのハンドラ。パスはマウスをクリックすると表示され、マウスを動かすと移動し、マウスを離すと終了します。


■ OpenLayers.Handler.Polygon
地図上にポリゴンを描画するためのハンドラ。パスはマウスをクリックすると表示され、マウスを動かすと移動し、マウスを離すと終了します。

2009年11月23日月曜日

OpenLayers 31a 距離や面積を計測 - Measure Example

OpenLayers Measure Example(measure.html)を参考にラベルの表示をします。

HTML ファイルを新規作成します。
「openlayersTokyoproj」 を右クリックして 新規 -> HTML ファイル をクリック。
「HTML ファイル」ウィンドウの「ファイル名(任意:openlayers_measure.html)」に入力して「完了」ボタンをクリック。
「charset」を「utf-8」にします。
「examples」の「measure.html」の内容をコピーして新規作成したファイルに貼り付けます。

コードの修正とちょっと解説します。

<html xmlns="http://www.w3.org/1999/xhtml">
<head>
<meta http-equiv="Content-Type" content="text/html; charset=utf-8">
<title>OpenLayers31 Measure Example</title>
<link rel="stylesheet" href="./theme/default/style.css" type="text/css" />
<link rel="stylesheet" href="./examples/style.css" type="text/css" />
<style type="text/css">
#controlToggle li {
list-style: none;
}
p {
width: 512px;
}
#options {
position: relative;
width: 512px;
}
#output {
float: right;
}
</style>

<!-- OpenLayers ライブラリ -->
<script src="./lib/Firebug/firebug.js"></script>
<script src="./lib/OpenLayers.js"></script>

<!-- Proj4js ライブラリ -->
<script type="text/javascript" src="./lib/proj4js/lib/proj4js-compressed.js"></script>
<script type="text/javascript" src="./lib/proj4js/lib/projCode/tmerc.js"></script>
<script type="text/javascript" src="./lib/proj4js/lib/defs/EPSG2456.js"></script>

<!-- Measure のコード -->

<script type="text/javascript">
var map, measureControls, layer1, layer2;
OpenLayers.Util.onImageLoadErrorColor = "transparent";
function init(){
// map = new OpenLayers.Map('map');
// 東京都用 map の設定
map = new OpenLayers.Map('map', {
projection: new OpenLayers.Projection("EPSG:2456"),
displayProjection: new OpenLayers.Projection("EPSG:4326"),
maxResolution: 'auto',
units: 'meters',
maxExtent: new OpenLayers.Bounds(-279000,1054000,-185000,1104000)
});
// ここまで
// ここから追加
layer1 = new OpenLayers.Layer.WMS( "Tokyo Height WMS",
"http://192.168.1.6/cgi-bin/mapserv?",
{
map: '/home/user/mapfile/tokyo_bmi_pgis_img.map',
layers: 'height',
format: 'image/png'
});

layer2 = new OpenLayers.Layer.WMS( "Tokyo Kukaku Sen WMS",
"http://192.168.1.6/cgi-bin/mapserv?",
{
map: '/home/user/mapfile/tokyo_bmi_pgis_img2.map',
layers: 'kukaku',
transparent: true,
format: 'image/png'
});
map.addLayers([layer1, layer2]);
// ここまで
map.addControl(new OpenLayers.Control.LayerSwitcher());
map.addControl(new OpenLayers.Control.MousePosition());
map.addControl(new OpenLayers.Control.ScaleLine()); // 追加

// style the sketch fancy

var sketchSymbolizers = {
"Point": {
pointRadius: 4,
graphicName: "square",
fillColor: "white",
fillOpacity: 1,
strokeWidth: 1,
strokeOpacity: 1,
strokeColor: "#333333"
},
"Line": {
strokeWidth: 3,
strokeOpacity: 1,
strokeColor: "#666666",
strokeDashstyle: "dash"
},
"Polygon": {
strokeWidth: 2,
strokeOpacity: 1,
strokeColor: "#666666",
fillColor: "white",
fillOpacity: 0.3
}
};

// style に上記 sketchSymbolizers を追加し、styleMap にデフォルトとして定義しています。

var style = new OpenLayers.Style();
style.addRules([
new OpenLayers.Rule({symbolizer: sketchSymbolizers})
]);
var styleMap = new OpenLayers.StyleMap({"default": style});

measureControls = {
line: new OpenLayers.Control.Measure( // 測定のためフィーチャの描画を許可
OpenLayers.Handler.Path, { //地図上にパスを描画するためのハンドラ
persist: true, //測定が完了した後、一時的な測定スケッチ描画を保持
handlerOptions: { //コントロールハンドラでデフォルトのプロパティ以外を設定するため使用
layerOptions: {styleMap: styleMap}
}
}
),
polygon: new OpenLayers.Control.Measure(
OpenLayers.Handler.Polygon, { //地図上にポリゴンを描画するためのハンドラ
persist: true,
handlerOptions: {
layerOptions: {styleMap: styleMap}
}
}
)
};

var control;
for(var key in measureControls) {
control = measureControls[key];
control.events.on({ // コントロールイベントが発生したとき
"measure": handleMeasurements, //測定スケッチが完了したときにトリガが発生
"measurepartial": handleMeasurements //新しいポイントが測定スケッチに追加されたときにトリガが発生
//リスナーは、測定、単位、順番、ジオメトリのプロパティのイベントを受信
});
map.addControl(control);
}

// map.setCenter(new OpenLayers.LonLat(0, 0), 3);
if (!map.getCenter()) {
map.zoomToMaxExtent()
};

document.getElementById('noneToggle').checked = true;
} End of function init()


function handleMeasurements(event) {
var geometry = event.geometry;
var units = event.units;
var order = event.order;
var measure = event.measure;
var element = document.getElementById('output');
var out = "";
if(order == 1) {
out += "measure: " + measure.toFixed(3) + " " + units; // 距離の表示
} else {
out += "measure: " + measure.toFixed(3) + " " + units + "<sup>2</" + "sup>"; // 面積の表示
}
element.innerHTML = out;
}

// measure distance, measure area が選択された場合

function toggleControl(element) {
for(key in measureControls) {
var control = measureControls[key];
if(element.value == key && element.checked) {
control.activate();
} else {
control.deactivate();
}
}
}
// use geodesic measures がチェックされた場合
function toggleGeodesic(element) {
for(key in measureControls) {
var control = measureControls[key];
control.geodesic = element.checked;
}
}
</script>
</head>

<!-- body 部分 -->

<body onload="init()">
<h1 id="title">OpenLayers Measure Example</h1>
<p id="shortdesc">
Demonstrates the measure control to measure distances and areas.
</p>
<div id="map" class="smallmap"></div>
<div id="options">
<div id="output"></div>
<ul id="controlToggle">
<li>
<input type="radio" name="type" value="none" id="noneToggle" onclick="toggleControl(this);" checked="checked" />
<label for="noneToggle">navigate</label>
</li>
<li>
<input type="radio" name="type" value="line" id="lineToggle" onclick="toggleControl(this);" />
<label for="lineToggle">measure distance</label>
</li>
<li>
<input type="radio" name="type" value="polygon" id="polygonToggle" onclick="toggleControl(this);" />
<label for="polygonToggle">measure area</label>
</li>
<li>
<input type="checkbox" name="geodesic" id="geodesicToggle" onclick="toggleGeodesic(this);" />
<label for="geodesicToggle">use geodesic measures</label>
</li>
</ul>
<p>Note that the geometries drawn are planar geometries and the
metrics returned by the measure control are planar measures by
default. If your map is in a geographic projection or you have the
appropriate projection definitions to transform your geometries into
geographic coordinates, you can set the "geodesic" property of the control
to true to calculate geodesic measures instead of planar measures.</p>
</div>
</body>
</html>


説明を訳してみました。

描画されたジオメトリは平面のジオメトリであり、メジャー(測定)コントロールによって返されたメトリックは、デフォルトによって平面測定であることに注意します。もし、あなたのマップが地理的投影であるか、ジオメトリを地理座標に変換するために、適切な投影の定義がある場合、平面の測定の代わりにgeodesic測定を計算するにはコントロールの"geodesic"プロパティをtrueに設定することでできます。

距離の測定

面積の測定

2009年11月22日日曜日

OpenLayers 30b OpenLayers.Renderer と OpenLayers.Geometry.Collection

Class Documents を訳してみました。


OpenLayers.Renderer

これは、すべての Renderer のための基本クラスです。

これは、ポールスペンサー、ベルティルシャピュイによって書かれた合併コードに基づいています。これは主に、技術に固有のサブクラスで実装される仮想関数で構成され、いくつかの汎用的なコードもあります。

ここで実装されている関数は、キャッシュ'解像度'の値と同じように、単にサイズと範囲変数を維持します。

正しくキャッシュシステムを使用するために、直接 this.resolution にアクセスする代わりに、すべてのサブクラスが getResolution()を使用すべきであることをユーザーは注意してください。


openlayers_labeledFeature.html の53行めあたり

var renderer = OpenLayers.Util.getParameters(window.location.href).renderer;
renderer = (renderer) ? [renderer] : OpenLayers.Layer.Vector.prototype.renderers;

と 73行めあたり

renderers: renderer

をコメントアウトしても地図の表示はできました。


OpenLayers.Geometry.Collection

コレクションは、実際にこの様になっています。異なるジオメトリのコレクションです。これらは、ローカルパラメータのコンポーネントに(これは、コンストラクタにパラメータとして渡されます)格納されます。

新規ジオメトリはコレクションに追加されるとき、クローンではありません。ジオメトリを削除するとき、それは reference によって指定される必要があります。(すなわち、削除されるためには、正確な座標で渡す必要があります)。

getAreaとgetLength関数は、ここでは単にそれぞれの地域と長さを合計するコンポーネントを繰り返します。

OpenLayers.Geometry.Collection コンストラクタを用いて新しいインスタンスを作成します。

2009年11月21日土曜日

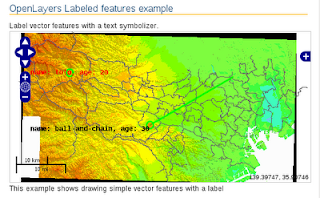
OpenLayers 30a ラベルの表示 - Labeled features

OpenLayers Labeled features example(vector-features-with-text.htm)を参考にラベルの表示をします。

HTML ファイルを新規作成します。
「openlayersTokyoproj」 を右クリックして 新規 -> HTML ファイル をクリック。
「HTML ファイル」ウィンドウの「ファイル名(任意:openlayers_labeledFeature.html)」に入力して「完了」ボタンをクリック。
「charset」を「utf-8」にします。
「examples」の「vector-features-with-text.html」の内容をコピーして新規作成したファイルに貼り付けます。

コードの修正とちょっと解説します。
フィーチャの attributes の値を表示します。

<html xmlns="http://www.w3.org/1999/xhtml">
<head>
<meta http-equiv="Content-Type" content="text/html; charset=utf-8">
<title>OpenLayers30 Labeled Features</title>
<link rel="stylesheet" href="./theme/default/style.css" type="text/css" />
<link rel="stylesheet" href="./examples/style.css" type="text/css" />

<!-- OpenLayers ライブラリ -->
<script src="./lib/Firebug/firebug.js"></script>
<script src="./lib/OpenLayers.js"></script>

<!-- Proj4js ライブラリ -->
<script type="text/javascript" src="./lib/proj4js/lib/proj4js-compressed.js"></script>
<script type="text/javascript" src="./lib/proj4js/lib/projCode/tmerc.js"></script>
<script type="text/javascript" src="./lib/proj4js/lib/defs/EPSG2456.js"></script>

<!-- Labeled Feature のコード -->

<script type="text/javascript">
var map, layer1, layer2;

function init(){
// map = new OpenLayers.Map('map');
// 東京都用 map の設定
map = new OpenLayers.Map('map', {
projection: new OpenLayers.Projection("EPSG:2456"),
displayProjection: new OpenLayers.Projection("EPSG:4326"),
maxResolution: 'auto',
units: 'meters',
maxExtent: new OpenLayers.Bounds(-279000,1054000,-185000,1104000)
});

// ここまで
// ここから追加

layer1 = new OpenLayers.Layer.WMS( "Tokyo Height WMS",
"http://192.168.1.6/cgi-bin/mapserv?",
{
map: '/home/user/mapfile/tokyo_bmi_pgis_img.map',
layers: 'height',
format: 'image/png'
});

layer2 = new OpenLayers.Layer.WMS( "Tokyo Kukaku Sen WMS",
"http://192.168.1.6/cgi-bin/mapserv?",
{
map: '/home/user/mapfile/tokyo_bmi_pgis_img2.map',
layers: 'kukaku',
transparent: true,
format: 'image/png'
});
map.addLayers([layer1, layer2]);

// ここまで
// allow testing of specific renderers via "?renderer=Canvas", etc

var renderer = OpenLayers.Util.getParameters(window.location.href).renderer;
renderer = (renderer) ? [renderer] : OpenLayers.Layer.Vector.prototype.renderers;
// ラベルなどのスタイル
var vectorLayer = new OpenLayers.Layer.Vector("Simple Geometry", {
styleMap: new OpenLayers.StyleMap({'default':{
strokeColor: "#00FF00",
strokeOpacity: 1,
strokeWidth: 3,
fillColor: "#FF5500",
fillOpacity: 0.5,
pointRadius: 6,
pointerEvents: "visiblePainted",
label : "name: ${name}, age: ${age}",

fontColor: "${favColor}",
fontSize: "12px",
fontFamily: "Courier New, monospace",
fontWeight: "bold",
labelAlign: "${align}"
}}),
renderers: renderer
});

// create a point feature

var displayProj = new OpenLayers.Projection("EPSG:4326"); // 追加

var point = new OpenLayers.Geometry.Point(139.1, 35.8);
var pointFeature = new OpenLayers.Feature.Vector(point);
pointFeature.attributes = {
name: "toto",
age: 20,
favColor: 'red',
align: "cm"
);
pointFeature.geometry.transform(displayProj, map.getProjectionObject()); // 追加

// create a polygon feature from a linear ring of points

var pointList = [];
for(var p=0; p<6; ++p) {
var a = p * (2 * Math.PI) / 7;
var r = Math.random(1) + 1;
var newPoint = new OpenLayers.Geometry.Point(
point.x + 5 + (r * Math.cos(a)),
point.y + 5 + (r * Math.sin(a))
);
pointList.push(newPoint);
}
pointList.push(pointList[0]);

var linearRing = new OpenLayers.Geometry.LinearRing(pointList);
var polygonFeature = new OpenLayers.Feature.Vector(
new OpenLayers.Geometry.Polygon([linearRing])
);
polygonFeature.attributes = {
name: "dude",
age: 21,
favColor: 'purple',
align: 'lb'
};
polygonFeature.geometry.transform(displayProj, map.getProjectionObject()); // 追加

multiFeature = new OpenLayers.Feature.Vector(
new OpenLayers.Geometry.Collection([
new OpenLayers.Geometry.LineString([
new OpenLayers.Geometry.Point(139.4, 35.65),
new OpenLayers.Geometry.Point(139.7, 35.8)
]),
new OpenLayers.Geometry.Point(139.4, 35.65)
]),
{
name: "ball-and-chain",
age: 30,
favColor: 'black',
align: 'rt'
}
);
multiFeature.geometry.transform(displayProj, map.getProjectionObject()); // 追加


var nullFeature = new OpenLayers.Feature.Vector(null);
nullFeature.attributes = {
name: "toto is some text about the world",
age: 20,
favColor: 'red',
align: "cm"
};

map.addLayer(vectorLayer);
vectorLayer.drawFeature(multiFeature);
// map.setCenter(new OpenLayers.LonLat(point.x, point.y), 3);
if (!map.getCenter()) {
map.zoomToMaxExtent()
};
vectorLayer.addFeatures([pointFeature, polygonFeature, multiFeature, nullFeature ]);
map.addControl(new OpenLayers.Control.LayerSwitcher()); // 追加
map.addControl(new OpenLayers.Control.MousePosition()); // 追加
map.addControl(new OpenLayers.Control.ScaleLine()); // 追加
}
</script>
</head>

<!-- body 部分 -->

<body onload="init()">
<h1 id="title">OpenLayers Labeled features example</h1>
<div id="tags"></div>
<p id="shortdesc">
Label vector features with a text symbolizer.
</p>
<div id="map" class="smallmap"></div>
<div id="docs">
This example shows drawing simple vector features with a label
</div>
</body>
</html>

2009年11月19日木曜日

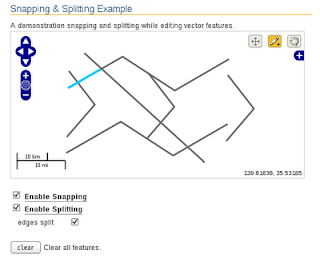
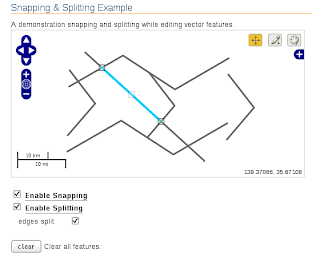
OpenLayers 29 ベクトル図の変形と分割 - Snapping & Splitting

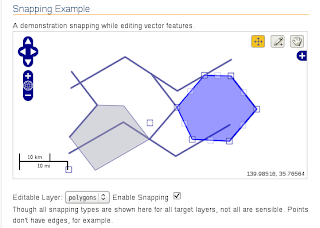
Snapping & Splitting Example(snap-split.html)を参考に GeoJson データでベクトル図の変形と分割をします。

HTML ファイルを新規作成します。
「openlayersTokyoproj」 を右クリックして 新規 -> HTML ファイル をクリック。
「HTML ファイル」ウィンドウの「ファイル名(任意:openlayers_snapSplit.html)」に入力して「完了」ボタンをクリック。
「charset」を「utf-8」にします。
「examples」の「snap-split.html」の内容をコピーして新規作成したファイルに貼り付けます。

コードの修正とちょっと解説します。
(Snapping の "node", "vertex", "edge" の設定がよく分からないので、この部分を省略したコードです。)
データを OpenLayers27 Split Feature の ol27_line.json を使用します。
分割したことの確認は、青くフラッシュすること以外に、snapping のために選択すると分かります。
Snapping したフィーチャと交差または接触したフィーチャも分割されます。


<html xmlns="http://www.w3.org/1999/xhtml">
<head>
<meta http-equiv="Content-Type" content="text/html; charset=utf-8">
<title>OpenLayers29 Snapping & Splitting</title>
<link rel="stylesheet" href="./theme/default/style.css" type="text/css" />
<link rel="stylesheet" href="./examples/style.css" type="text/css" />
<style type="text/css">
// 編集ボタンのスタイル
.olControlEditingToolbar .olControlModifyFeatureItemInactive {
background-position: -1px 0px ;
}
.olControlEditingToolbar .olControlModifyFeatureItemActive {
background-position: -1px -23px ;
}
label.head {
font-weight: bold;
padding: 1em 0 0.1em 0;
border-bottom: 1px solid grey;
}
// テーブル(表)のスタイル
td {
padding: 0.25em 1em;
}
tr.head td {
text-align: center;
font-weight: bold;
}
</style>
<!-- OpenLayers ライブラリ -->
<script src="./lib/Firebug/firebug.js"></script>
<script src="./lib/OpenLayers.js"></script>

<!-- Proj4js ライブラリ -->
<script type="text/javascript" src="./lib/proj4js/lib/proj4js-compressed.js"></script>
<script type="text/javascript" src="./lib/proj4js/lib/projCode/tmerc.js"></script>
<script type="text/javascript" src="./lib/proj4js/lib/defs/EPSG2456.js"></script>

<!-- Snapping & Splitting のスクリプト -->

<script type="text/javascript">
OpenLayers.Feature.Vector.style['default']['strokeWidth'] = '2';

function init() {
initMap();
initUI();
}

var map, draw, modify, snap, split, vectors;
function initMap() {
// map = new OpenLayers.Map('map');
// 東京都用 map の設定
map = new OpenLayers.Map('map', {
projection: new OpenLayers.Projection("EPSG:2456"),
displayProjection: new OpenLayers.Projection("EPSG:4326"),
maxResolution: 'auto',
units: 'meters',
maxExtent: new OpenLayers.Bounds(-279000,1054000,-185000,1104000)
});

// ここまで
// スタイル(通常、選択、編集中)の設定

var styles = new OpenLayers.StyleMap({
"default": new OpenLayers.Style(null, {
rules: [
new OpenLayers.Rule({
symbolizer: {
"Point": {
pointRadius: 5,
graphicName: "square",
fillColor: "white",
fillOpacity: 0.25,
strokeWidth: 1,
srokeOpacity: 1,
strokeColor: "#333333"
},
"Line": {
strokeWidth: 3,
strokeOpacity: 1,
strokeColor: "#666666"
}
}
})
]
}),
"select": new OpenLayers.Style({
strokeColor: "#00ccff",
strokeWidth: 4
}),
"temporary": new OpenLayers.Style(null, {
rules: [
new OpenLayers.Rule({
symbolizer: {
"Point": {
pointRadius: 5,
graphicName: "square",
fillColor: "white",
fillOpacity: 0.25,
strokeWidth: 1,
strokeOpacity: 1,
strokeColor: "#333333"
},
"Line": {
strokeWidth: 3,
strokeOpacity: 1,
strokeColor: "#00ccff"
}
}
})
]
})
});

// create three vector layers

vectors = new OpenLayers.Layer.Vector("Lines", {
isBaseLayer: true,
strategies: [new OpenLayers.Strategy.Fixed()],
protocol: new OpenLayers.Protocol.HTTP({
url: "ol27_line2.json",
format: new OpenLayers.Format.GeoJSON({
internalProjection: new OpenLayers.Projection("EPSG:2456"),
externalProjection: new OpenLayers.Projection("EPSG:4326")
})
}),
styleMap: styles,
});
map.addLayer(vectors);

// configure the snapping agent

snap = new OpenLayers.Control.Snapping({layer: vectors});
map.addControl(snap);
snap.activate();

// configure split agent

/*
*source
*新しく作成されたフィーチャまたは変形されたフィーチャが提供された場合、
*ターゲットレイヤ上でフィーチャを分割するために使用されます。
*提供されない場合は、一時的なスケッチレイヤが線を描画するために作成されます。
*tolerance
*頂点で発生する分割下のソースの頂点と計算された交差点間の距離のオプションの値。
*/
split = new OpenLayers.Control.Split({
layer: vectors,
source: vectors,
tolerance: 0.0001,
eventListeners: {
aftersplit: function(event) {
flashFeatures(event.features);
}
}
});
map.addControl(split);
split.activate();

// add some editing tools to a panel

var panel = new OpenLayers.Control.Panel({
displayClass: "olControlEditingToolbar"
});
draw = new OpenLayers.Control.DrawFeature(
vectors, OpenLayers.Handler.Path,{
displayClass: "olControlDrawFeaturePoint",
title: "Draw Features"
}
);
modify = new OpenLayers.Control.ModifyFeature(
vectors, {
displayClass: "olControlModifyFeature",
title: "Modify Features"
}
);
panel.addControls([
new OpenLayers.Control.Navigation({title: "Navigate"}),
draw, modify
]);
map.addControl(panel);

map.addControl(new OpenLayers.Control.MousePosition());
map.addControl(new OpenLayers.Control.LayerSwitcher()); // 追加
map.addControl(new OpenLayers.Control.ScaleLine()); // 追加

map.zoomToMaxExtent();
} // End of initMap()

// 分割後のフラッシュ

function flashFeatures(features, index) {
if(!index) {
index = 0;
}
var current = features[index];
if(current && current.layer === vectors) {
vectors.drawFeature(features[index], "select");
}
var prev = features[index-1];
if(prev && prev.layer === vectors) {
vectors.drawFeature(prev, "default");
}
++index;
if(index <= features.length) {
window.setTimeout(function() {flashFeatures(features, index)}, 1000); // 1000ミリ秒に修正
}
}

// Snapping と Splitting をチェックしたときの動作

/**
* Add behavior to page elements. This basically lets us set snapping
* target properties with the checkboxes and text inputs. The checkboxes
* toggle the target node, vertex, or edge (boolean) values. The
* text inputs set the nodeTolerance, vertexTolerance, or edgeTolerance
* property values.
*/
function initUI() {
// add behavior to snap elements
var snapCheck = $("snap_toggle");
snapCheck.checked = true;
snapCheck.onclick = function() {
if(snapCheck.checked) {
snap.activate();
$("snap_options").style.display = "block";
} else {
snap.deactivate();
$("snap_options").style.display = "none";
}
};
// add behavior to split elements
var splitCheck = $("split_toggle");
splitCheck.checked = true;
splitCheck.onclick = function() {
if(splitCheck.checked) {
split.activate();
$("split_options").style.display = "block";
} else {
split.deactivate();
$("split_options").style.display = "none";
}
};
var edgeCheck = $("edge_toggle");
edgeCheck.checked = split.edge;
edgeCheck.onclick = function() {
split.edge = edgeCheck.checked;
};
// フィーチャ消去
$("clear").onclick = function() {
modify.deactivate();
vectors.destroyFeatures();
};

}

</script>
</head>

<!-- body 部分 -->

<body onload="init()">
<h1 id="title">Snapping & Splitting Example</h1>
<div id="shortdesc">A demonstration snapping and splitting while editing vector features.</div>
<div id="map" class="smallmap"></div>
<br/>
<input type="checkbox" id="snap_toggle" />
<label for="snap_toggle" class="head">Enable Snapping</label>
<br />
<input type="checkbox" id="split_toggle" />
<label for="split_toggle" class="head">Enable Splitting</label>
<table id="split_options">
<tbody>
<tr>
<td><label for="edge_toggle">edges split</label></td>
<td><input type="checkbox" id="edge_toggle" /></td>
</tr>
</tbody>
</table>
<br />
<button id="clear">clear</button> Clear all features.
</body>
</html>


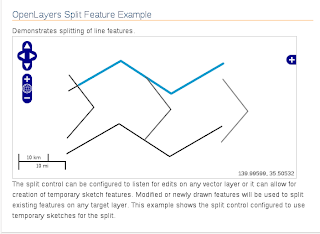
Split 分割のために描画した直線が残って表示されています。


Snap 分割のために描画した直線藻分割されていました。

2009年11月18日水曜日

OpenLayers 28b OpenLayers.Control.Split と addUniqueValueRules について

OpenLayers.Control.Split
(英文の説明の訳)

分割コントロールは、任意のベクトルレイヤー上の編集をリッスン?するように構成することができます、または一時的なスケッチ機能の作成を可能にすることができます。変形されたまたは新たに描画されたフィーチャは、任意のターゲットレイヤ上の既存のフィーチャを分割するために使用されます。この例では、分割コントロールが分割するための一時的なスケッチを使用して構成することを示しています。


addUniqueValueRules について

OpenLayers の Styling サイト

http://docs.openlayers.org/library/feature_styling.html#adduniquevaluerules

に addUniqueValueRules についての解説があります。

addUniqueValueRules を使用するためには、まず最初に、スタイルの'共有'プロパティで StyleMap作成します。'サムネイル'属性内に URL でフィーチャを読み込んでいることを考えます:

var styleMap = new OpenLayers.StyleMap({externalGraphic: '${thumbnail}'});

次に、フィーチャの属性の値とsymbolizer値の間のマッピングを作成し、それから、"サイズ"属性をチェックし、その変数に定義された symbolizer に適用するそのデフォルトの symbolizer にルールを追加します:

var lookup = {
"small": {pointRadius: 10},
"large": {pointRadius: 30}
}

styleMap.addUniqueValueRules("default", "size", lookup);

これは 'default' renderIntent において スタイルにルールを追加し、そのスタイルはフィーチャの'サイズ'属性に基づいた pointRadius を変更をすべきということです。
symbolizers インサイドルールは symbolizers を完了する必要はありません。
なぜなら、OpenLayers.Style またはOpenLayers.StyleMap のコンストラクタで渡されたデフォルトのsymbolizer を拡張するためです。
'Unique Values example'は、addUniqueValueRulesの使用方法を示します。

2009年11月17日火曜日

OpenLayers 28a ベクトル図の変形 - Split Feature

OpenLayers Split Feature Example(split-feature.html)を参考に GeoJson データでベクトル図を変形します。

HTML ファイルを新規作成します。
「openlayersTokyoproj」 を右クリックして 新規 -> HTML ファイル をクリック。
「HTML ファイル」ウィンドウの「ファイル名(任意:openlayers_split.html)」に入力して「完了」ボタンをクリック。
「charset」を「utf-8」にします。
「examples」の「split-feature.html」の内容をコピーして新規作成したファイルに貼り付けます。

コードの修正とちょっと解説します。
データを OpenLayers27 Split Feature の ol27_line.json を使用します。

OpenLayers.Control.Split は分割するフィーチャがあるレイヤ上に、一時的に生成させたスケッチレイヤに描画したフィーチャ(line)が交差した部分からフィーチャを分割します。

<html xmlns="http://www.w3.org/1999/xhtml">
<head>
<title>OpenLayers28 Split Feature</title>

<link rel="stylesheet" href="./theme/default/style.css" type="text/css" />
<link rel="stylesheet" href="./examples/style.css" type="text/css" />

<!-- OpenLayers ライブラリ -->
<script src="./lib/Firebug/firebug.js"></script>
<script src="./lib/OpenLayers.js"></script>

<!-- Proj4js ライブラリ -->
<script type="text/javascript" src="./lib/proj4js/lib/proj4js-compressed.js"></script>
<script type="text/javascript" src="./lib/proj4js/lib/projCode/tmerc.js"></script>
<script type="text/javascript" src="./lib/proj4js/lib/defs/EPSG2456.js"></script>

<!-- Split Feature コード -->

<script type="text/javascript">
var map, vectors, split;
OpenLayers.Util.onImageLoadErrorColor = "transparent";
function init(){
// map = new OpenLayers.Map('map');
// 東京都用 map の設定
map = new OpenLayers.Map('map', {
projection: new OpenLayers.Projection("EPSG:2456"),
displayProjection: new OpenLayers.Projection("EPSG:4326"),
maxResolution: 'auto',
units: 'meters',
maxExtent: new OpenLayers.Bounds(-279000,1054000,-185000,1104000)
});
// ここまで

// give the features some style

var styles = new OpenLayers.StyleMap({
"default": {
strokeWidth: 2
},
"select": {
strokeColor: "#0099cc",
strokeWidth: 4
}
});

// add rules from the above lookup table
// "RP_TYPE": road.json の道路データの "properties" メンバーの1つ
// "default" のスタイルの次に "RP_TYPE" スタイルに修正されます。
// 修正の内容は ","(カンマ)に続けて表記します。

styles.addUniqueValueRules("default", "RP_TYPE", {
10: {strokeColor: "#000000", strokeWidth: 2}, // 最初の数字は "RP_TYPE" の番号
12: {strokeColor: "#222222", strokeWidth: 2},
14: {strokeColor: "#444444", strokeWidth: 2},
16: {strokeColor: "#666666", strokeWidth: 2},
18: {strokeColor: "#888888", strokeWidth: 2},
19: {strokeColor: "#666666", strokeWidth: 1}
});

vectors = new OpenLayers.Layer.Vector("Lines", {
isBaseLayer: true,
strategies: [new OpenLayers.Strategy.Fixed()],
protocol: new OpenLayers.Protocol.HTTP({
url: "ol27_line2.json", // openlayers27 のデータを使用
format: new OpenLayers.Format.GeoJSON({
internalProjection: new OpenLayers.Projection("EPSG:2456"),
externalProjection: new OpenLayers.Projection("EPSG:4326")
})
}),
styleMap: styles,
/* 削除
maxExtent: new OpenLayers.Bounds(
1549471.9221, 6403610.94, 1550001.32545, 6404015.8
)
*/
});

map.addLayer(vectors);

map.addControl(new OpenLayers.Control.MousePosition());
map.addControl(new OpenLayers.Control.LayerSwitcher()); // 追加
map.addControl(new OpenLayers.Control.ScaleLine()); // 追加

// フィーチャを分割するコード

var split = new OpenLayers.Control.Split({
layer: vectors,
eventListeners: {
aftersplit: function(event) {
flashFeatures(event.features);
}
}
});
map.addControl(split);
split.activate();
map.zoomToMaxExtent();

} // End of function init()

// 分割後のフラッシュ

function flashFeatures(features, index) {
if(!index) {
index = 0;
}
var current = features[index];
if(current && current.layer === vectors) {
vectors.drawFeature(features[index], "select");
}
var prev = features[index-1];
if(prev && prev.layer === vectors) {
vectors.drawFeature(prev, "default");
}
++index;
if(index <= features.length) {
window.setTimeout(function() {flashFeatures(features, index)}, 1000); // 1000ミリ秒に修正
}
}

</script>

</head>
<!-- body 部分 -->

<body onload="init()">
<h1 id="title">OpenLayers Split Feature Example</h1>
<p id="shortdesc">
Demonstrates splitting of line features.
</p>
<div id="map" class="smallmap"></div>
<div id="docs">
The split control can be configured to listen for edits on any vector layer
or it can allow for creation of temporary sketch features. Modified or
newly drawn features will be used to split existing features on any target
layer. This example shows the split control configured to use temporary
sketches for the split.
</div>
</body>
</html>


road,json の内容

{
"type": "FeatureCollection",
"features": [
{
"type": "Feature","properties": {
"LINK_ID": 30760460.000000,
"RP_TYPE": 12,
"RP_FUNC": 0,
"DIRECTION": 1,
"LOGKOD": "",
"CHANGED": "",
"USERID": "",
"ST_NAME": "KVARNGATAN",
"L_REFADDR": "24",
"L_NREFADDR": "22",
"R_REFADDR": "27",
"R_NREFADDR": "23",
"SPEED_CAT": "6",
"ZIPCODE": "59333",
"SHAPE_LEN": 41.871700
},
"geometry": {
"type": "LineString",
"coordinates": [
[ 1549555.330250, 6403958.170400 ],
[ 1549594.439950, 6403973.130400 ]
]
}
},
---

ol27_line.json の修正

{
"type": "FeatureCollection",
"features": [
{
"type":"Feature",
"id":"OL_Snap_Test_Point1",
"properties":{"RP_TYPE": 10}, // "RP_TYPE" を追加(他のフィーチャも番号を換えて追加)
"geometry":{
"type":"Point",
"coordinates":[139.1, 35.5]
},
"crs":{
"type":"OGC",
"properties":{
"urn":"urn:ogc:def:crs:OGC:1.3:CRS84"
}}
},
---


2009年11月16日月曜日

OpenLayers 27b ベクトル図の変形 - GeoJson のデータ

GeoJson については以前、「OpenLayers 19d GeoJSON でレイヤ描画」で簡単にふれました。
GeoJSON のホームページ(http://geojson.org/)を参考にして、ポイントを例にデータをもう少し詳しくみてみます。
最初に出てくる

"type": "FeatureCollection"

は、GeoJSON のホームページ(http://geojson.org/)spec サイト(http://geojson.org/geojson-spec.html)の 「2.3 Feature Collection Objects」に
あるように、GeoJson オブジェクトが feature collection オブジェクトであることを宣言しています。
これによって feature オブジェクトも宣言します。

{
"type": "FeatureCollection",
"features": [
{
"type":"Feature",
---

features には他に、"geometry" と "property"(両方必須)、"id" を設定します。

"features": [
{
"type":"Feature",
"id":"OpenLayers.Feature.Vector_1721",
"properties":{},
"geometry":{
"type":"Point",
"coordinates":[-89.296875, -14.4140625]
},
---

続けて、coordinate reference system (CRS: 座標参照システム?)は、crs メンバーで決定します。
オブジェクトが crs メンバーを取得できないときは、デフォルトの CRS が GeoJSON に適用されます。

(GeoJSON のホームページ(http://geojson.org/)spec サイト(http://geojson.org/geojson-spec.html)の「2. GeoJSON Objects」試しに訳してみました)
●デフォルトの CRS は、地理的座標参照システム?で、WGS84(世界で最も汎用される楕円体)データを使い、10進法の度数単位の経緯度で表示します。
●メンバー名「crs」の値は、JSON オブジェクト(下記の CRS オブジェクトとして参照されます)または null 値の JSON でなければなりません。
CRS 値が null のとき、CRS がないと仮定されます。
●crs メンバーは、(feature collection, feature, geometry 順の)ヒエラルキー(段階的分類) で最上位 GeoJSON オブジェクト上に存在し、子または孫オブジェクト上で繰替えされるか無効になります。
●null 値でない CRS オブジェクトは、2つの必須のメンバー type と properties を持ちます。
●type メンバーの値は文字で、CRS オブジェクトの type を示します。
●properties メンバーの値はオブジェクトです。
●CRS は座標の順序を変えられません。

CRS はつぎのように記述します。

"crs":{
"type":"OGC",
"properties":{
"urn":"urn:ogc:def:crs:OGC:1.3:CRS84"
}}
},


Best Practices OGC URNs サイト

http://www.oostethys.org/best-practices/best-practices-ogc-urns

を参考に URN についてみてみます。
一般的な URN の形式は次の様になります。

urn:$organization:string_unique_to_organization

$organization コードは、IANAから要求される正式なコードです。

OGCの内の項目を指定するためのURNの推奨フォームは、OGCの 05-010 によって与えられ、その形式は:

urn:ogc:def:objectType:authority:version:code

: (コロン)は必ず6個必要です。

バージョンがない場合、バージョン文字列は null で、コロンはもう一つのコロンの後に表示されます。

urn:ogc:def:crs:EPSG::4326


使用した GeoJSON データ

ol27_polygon.json の一部

{
"type": "FeatureCollection",
"features": [
{
"type":"Feature",
"id":"OL_Snap_Test_Polygon1",
"properties":{},
"geometry":{
"type":"Polygon",
"coordinates":[
[
[139.1, 35.6],[139.2, 35.7],[139.3, 35.7],[139.4, 35.6],[139.2, 35.5],[139.1, 35.6]
]]},
"crs":{
"type":"OGC",
"properties":{
"urn":"urn:ogc:def:crs:OGC:1.3:CRS84"
}}
},
---

2009年11月15日日曜日

OpenLayers 27a ベクトル図の変形 - Snapping

OpenLayers Select and Highlight Feature Example(highlight-feature.html) を参考に GeoJson データでベクトル図を変形します。

HTML ファイルを新規作成します。
「openlayersTokyoproj」 を右クリックして 新規 -> HTML ファイル をクリック。
「HTML ファイル」ウィンドウの「ファイル名(任意:openlayers_snapping.html)」に入力して「完了」ボタンをクリック。
「charset」を「utf-8」にします。
「examples」の「snapping.html」の内容をコピーして新規作成したファイルに貼り付けます。

コードの修正とちょっと解説します。
(Snapping の "node", "vertex", "edge" の設定がよく分からないので、この部分を省略したコードです。)

<html xmlns="http://www.w3.org/1999/xhtml">
<head>
<title>OpenLayers27 Snapping</title>
<link rel="stylesheet" href="./theme/default/style.css" type="text/css" />
<link rel="stylesheet" href="./examples/style.css" type="text/css" />

<!-- 編集ボタンのスタイル -->
<style type="text/css">
.olControlEditingToolbar .olControlModifyFeatureItemInactive {
background-position: -1px 0px;
}
.olControlEditingToolbar .olControlModifyFeatureItemActive {
background-position: -1px -23px;
}
</style>

<!-- OpenLayers ライブラリ -->
<script src="./lib/Firebug/firebug.js"></script>
<script src="./lib/OpenLayers.js"></script>

<!-- Proj4js ライブラリ -->
<script type="text/javascript" src="./lib/proj4js/lib/proj4js-compressed.js"></script>
<script type="text/javascript" src="./lib/proj4js/lib/projCode/tmerc.js"></script>
<script type="text/javascript" src="./lib/proj4js/lib/defs/EPSG2456.js"></script>

<!-- Snapping コード -->

<script type="text/javascript">
OpenLayers.Feature.Vector.style['default']['strokeWidth'] = '2';

function init() {
initMap();
initUI();
}

var map, draw, modify, snap, point, line, poly;
function initMap() {

// map = new OpenLayers.Map('map');
// 東京都用 map の設定
map = new OpenLayers.Map('map', {
projection: new OpenLayers.Projection("EPSG:2456"),
displayProjection: new OpenLayers.Projection("EPSG:4326"),
maxResolution: 'auto',
units: 'meters',
maxExtent: new OpenLayers.Bounds(-279000,1054000,-185000,1104000)
});

// スタイル(通常、選択、編集中)の設定

var styles = new OpenLayers.StyleMap({
"default": new OpenLayers.Style(null, {
rules: [
new OpenLayers.Rule({
symbolizer: {
"Point": {
pointRadius: 5,
graphicName: "square",
fillColor: "white",
fillOpacity: 0.25,
strokeWidth: 1,
strokeOpacity: 1,
strokeColor: "#3333aa"
},
"Line": {
strokeWidth: 3,
strokeOpacity: 1,
strokeColor: "#6666aa"
},
"Polygon": {
strokeWidth: 1,
strokeOpacity: 1,
fillColor: "#9999aa",
strokeColor: "#6666aa"
}
}
})
]
}),
"select": new OpenLayers.Style(null, {
rules: [
new OpenLayers.Rule({
symbolizer: {
"Point": {
pointRadius: 5,
graphicName: "square",
fillColor: "white",
fillOpacity: 0.25,
strokeWidth: 2,
strokeOpacity: 1,
strokeColor: "#0000ff"
},
"Line": {
strokeWidth: 3,
strokeOpacity: 1,
strokeColor: "#0000ff"
},
"Polygon": {
strokeWidth: 2,
strokeOpacity: 1,
fillColor: "#0000ff",
strokeColor: "#0000ff"
}
}
})
]
}),
"temporary": new OpenLayers.Style(null, {
rules: [
new OpenLayers.Rule({
symbolizer: {
"Point": {
graphicName: "square",
pointRadius: 5,
fillColor: "white",
fillOpacity: 0.25,
strokeWidth: 2,
strokeColor: "#0000ff"
},
"Line": {
strokeWidth: 3,
strokeOpacity: 1,
strokeColor: "#0000ff"
},
"Polygon": {
strokeWidth: 2,
strokeOpacity: 1,
strokeColor: "#0000ff",
fillColor: "#0000ff"
}
}
})
]
})
});

// create three vector layers

poly = new OpenLayers.Layer.Vector("polygons", {
strategies: [new OpenLayers.Strategy.Fixed()],
protocol: new OpenLayers.Protocol.HTTP({
url: "ol27_polygon.json", // 修正した東京都の範囲のデータ
format: new OpenLayers.Format.GeoJSON({ // map の設定に合わせて修正
internalProjection: new OpenLayers.Projection("EPSG:2456"),
externalProjection: new OpenLayers.Projection("EPSG:4326")
}),
}),
isBaseLayer: true,
styleMap: styles
});
line = new OpenLayers.Layer.Vector("lines", {
strategies: [new OpenLayers.Strategy.Fixed()],
protocol: new OpenLayers.Protocol.HTTP({
url: "ol27_line.json",
format: new OpenLayers.Format.GeoJSON({
internalProjection: new OpenLayers.Projection("EPSG:2456"),
externalProjection: new OpenLayers.Projection("EPSG:4326")
}),
}),
styleMap: styles
});
point = new OpenLayers.Layer.Vector("points", {
strategies: [new OpenLayers.Strategy.Fixed()],
protocol: new OpenLayers.Protocol.HTTP({
url: "ol27_point.json",
format: new OpenLayers.Format.GeoJSON({
internalProjection: new OpenLayers.Projection("EPSG:2456"),
externalProjection: new OpenLayers.Projection("EPSG:4326")
}),
}),
styleMap: styles
});
map.addLayers([poly, line, point]);

// configure the snapping agent

snap = new OpenLayers.Control.Snapping({
layer: poly,
targets: [point, line, poly],
greedy: false
});
snap.activate();

// add some editing tools to a panel
var panel = new OpenLayers.Control.Panel({
displayClass: "olControlEditingToolbar"
});
draw = new OpenLayers.Control.DrawFeature(
poly, OpenLayers.Handler.Polygon, {displayClass: "olControlDrawFeaturePoint", title: "Draw Features"}
);
modify = new OpenLayers.Control.ModifyFeature(
poly, {displayClass: "olControlModifyFeature", title: "Modify Features"}
);
panel.addControls([
new OpenLayers.Control.Navigation({title: "Navigate"}),
draw, modify
]);
map.addControl(panel);
// レイヤスイッチャ、マウスポジション、スケールラインのコントロール設置
map.addControl(new OpenLayers.Control.LayerSwitcher());
map.addControl(new OpenLayers.Control.MousePosition());
map.addControl(new OpenLayers.Control.ScaleLine());

// give the map a location
// map.setCenter(new OpenLayers.LonLat(0, 0), 1);
if (!map.getCenter()) {
map.zoomToMaxExtent()
};
}

/**
* Add behavior to page elements. This basically lets us set snapping
* target properties with the checkboxes and text inputs. The checkboxes
* toggle the target node, vertex, or edge (boolean) values. The
* text inputs set the nodeTolerance, vertexTolerance, or edgeTolerance
* property values.
*/

function initUI() {
var check = $("snapping");
check.checked = true;
check.onclick = function() {
if(check.checked) {
snap.activate();
} else {
snap.deactivate();
}
};

var sel = $("editable");
sel.value = "poly";
sel.onchange = function() {
updateEditable(sel.value);
}

}

// this function allows the editable layer to be changed
// for the snapping control, this amounts to calling setLayer

function updateEditable(name) {
layer = window[name];

// update the editable layer for the snapping control (nice)

snap.setLayer(layer);

// update the editable layer for the modify control (ugly)

var modActive = modify.active;
if(modActive) {
modify.deactivate();
}
modify.layer = layer;
modify.selectControl.layer = layer;
modify.selectControl.handlers.feature.layer = layer;
modify.dragControl.layer = layer;
modify.dragControl.handlers.drag.layer = layer;
modify.dragControl.handlers.feature.layer = layer;
if(modActive) {
modify.activate();
}

// update the editable layer for the draw control (very ugly)
var drawActive = draw.active;
if(drawActive) {
draw.deactivate();
}
draw.layer = layer;
var handler = ({
point: OpenLayers.Handler.Point,
line: OpenLayers.Handler.Path,
poly: OpenLayers.Handler.Polygon
})[name];
draw.handler = new handler(draw, draw.callbacks, draw.handlerOptions);
if(drawActive) {
draw.activate();
}

}
</script>
</head>

<!-- body 部分 -->

<body onload="init()">
<h1 id="title">Snapping Example</h1>
<div id="shortdesc">A demonstration snapping while editing vector features.</div>
<div id="map" class="smallmap"></div>
<br/>
<label for="editable">Editable Layer:</label>
<select id="editable" name="editable">
<option value="poly">polygons</option>
<option value="line">lines</option>
<option value="point">points</option>
</select>
<label for="snapping">Enable Snapping</label>
<input type="checkbox" name="snapping" id="snapping" checked="checked" />

<p>Though all snapping types are shown here for all target layers, not all are sensible.
Points don't have edges, for example.</p>
</body>
</html>


2009年11月14日土曜日

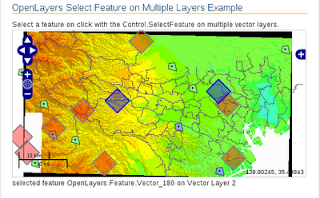
OpenLayers 26 複数のレイヤで Feature を選択したときに色を変える

OpenLayers Select Feature on Multiple Layers Example(select-feature-multilayer.html) を参考に複数のレイヤで Feature を選択したときに色を変えます。

HTML ファイルを新規作成します。
「openlayersTokyoproj」 を右クリックして 新規 -> HTML ファイル をクリック。
「HTML ファイル」ウィンドウの「ファイル名(任意:openlayers_feature_multilayer.html)」に入力して「完了」ボタンをクリック。
「charset」を「utf-8」にします。
「examples」の「select-feature-multilayer.html」の内容をコピーして新規作成したファイルに貼り付けます。

次の様にコードを修正します。
(範囲を東京都の地図に合わせてみました。)

<html xmlns="http://www.w3.org/1999/xhtml">
<head>
<meta http-equiv="Content-Type" content="text/html; charset=utf-8" />
<title>SelectFeature Control on multiple vector layers</title>
<link rel="stylesheet" href="./theme/default/style.css" type="text/css" />
<link rel="stylesheet" href="./examples/style.css" type="text/css" />
<style type="text/css">
#controlToggle li {
list-style: none;
}
</style>
<script src="./lib/OpenLayers.js"></script>

<script type="text/javascript" src="./lib/proj4js/lib/proj4js-compressed.js"></script>
<script type="text/javascript" src="./lib/proj4js/lib/projCode/tmerc.js"></script>
<script type="text/javascript" src="./lib/proj4js/lib/defs/EPSG2456.js"></script>

<!-- JavaScript 本体 -->

<script type="text/javascript">
var map, selectControl;
OpenLayers.Feature.Vector.style['default']['strokeWidth'] = '2';
function init(){
// map = new OpenLayers.Map('map');
// ここから
map = new OpenLayers.Map('map', {
projection: new OpenLayers.Projection("EPSG:2456"),
displayProjection: new OpenLayers.Projection("EPSG:4326"),
maxResolution: 'auto',
units: 'meters',
maxExtent: new OpenLayers.Bounds(-279000,1054000,-185000,1104000)
});

layer1 = new OpenLayers.Layer.WMS( "Tokyo Height WMS",
"http://192.168.1.6/cgi-bin/mapserv?",
{
map: '/home/user/mapfile/tokyo_bmi_pgis_img.map',
layers: 'height',
format: 'image/png'
});

layer2 = new OpenLayers.Layer.WMS( "Tokyo Kukaku Sen WMS",
"http://192.168.1.6/cgi-bin/mapserv?",
{
map: '/home/user/mapfile/tokyo_bmi_pgis_img2.map',
layers: 'kukaku',
transparent: true,
format: 'image/png'
});

// ここまで
// マーカとスクエア(ダイヤ)の表示レイヤとスタイルの設定

var vectors1 = new OpenLayers.Layer.Vector("Vector Layer 1", {
styleMap: new OpenLayers.StyleMap({
"default": new OpenLayers.Style(OpenLayers.Util.applyDefaults({
externalGraphic: "./img/marker-green.png",
graphicOpacity: 1,
rotation: -45,
pointRadius: 10
}, OpenLayers.Feature.Vector.style["default"])),
"select": new OpenLayers.Style({
externalGraphic: "./img/marker-blue.png"
})
})
});
var vectors2 = new OpenLayers.Layer.Vector("Vector Layer 2", {
styleMap: new OpenLayers.StyleMap({
"default": new OpenLayers.Style(OpenLayers.Util.applyDefaults({
fillColor: "red",
strokeColor: "gray",
graphicName: "square",
rotation: 45,
pointRadius: 15
}, OpenLayers.Feature.Vector.style["default"])),
"select": new OpenLayers.Style(OpenLayers.Util.applyDefaults({
graphicName: "square",
rotation: 45,
pointRadius: 15
}, OpenLayers.Feature.Vector.style["select"]))
})
});
// map.addLayers([wmsLayer, vectors1, vectors2]);
map.addLayers([layer1, layer2, vectors1, vectors2]);

map.addControl(new OpenLayers.Control.LayerSwitcher());
map.addControl(new OpenLayers.Control.MousePosition());
map.addControl(new OpenLayers.Control.ScaleLine());

// フィーチャを選択(クリック)したときの動作(+Shiftキー、+Ctrlキー)

selectControl = new OpenLayers.Control.SelectFeature(
[vectors1, vectors2],
{
clickout: true, toggle: false,
multiple: false, hover: false,
toggleKey: "ctrlKey", // ctrl key removes from selection
multipleKey: "shiftKey" // shift key adds to selection
}
);

map.addControl(selectControl);
selectControl.activate();
// map.setCenter(new OpenLayers.LonLat(0, 0), 3);
if (!map.getCenter()) {
map.zoomToMaxExtent()
};
vectors1.addFeatures(createFeatures());
vectors2.addFeatures(createFeatures());

// 選択したフィーチャの id の表示内容

vectors1.events.on({
"featureselected": function(e) {
showStatus("selected feature "+e.feature.id+" on Vector Layer 1");
},
"featureunselected": function(e) {
showStatus("unselected feature "+e.feature.id+" on Vector Layer 1");
}
});
vectors2.events.on({
"featureselected": function(e) {
showStatus("selected feature "+e.feature.id+" on Vector Layer 2");
},
"featureunselected": function(e) {
showStatus("unselected feature "+e.feature.id+" on Vector Layer 2");
}
});
}

// フィーチャの自動生成

function createFeatures() {
var extent = map.getExtent();
var features = [];
for(var i=0; i<10; ++i) {
features.push(new OpenLayers.Feature.Vector(
new OpenLayers.Geometry.Point(extent.left + (extent.right - extent.left) * Math.random(),
extent.bottom + (extent.top - extent.bottom) * Math.random()
)));
}
return features;
}

// フィーチャ id の表示

function showStatus(text) {
document.getElementById("status").innerHTML = text;
}

</script>
</head>
<body onload="init()">
<h1 id="title">OpenLayers Select Feature on Multiple Layers Example</h1>
<p id="shortdesc">
Select a feature on click with the Control.SelectFeature on multiple
vector layers.
</p>
<div id="map" class="smallmap"></div>
<div id="status"></div>
</body>
</html>


Shift + クリック でマーカはマーカの画像、スクエア図はマップを別ウィンドウで表示
Ctrl + クリック でマーカはマーカの画像、スクエア図はマップを別タグで表示
してしまいました。

2009年11月12日木曜日

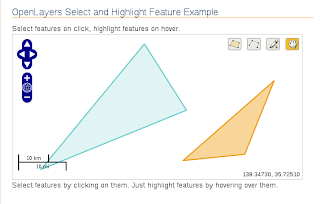
OpenLayers 25 Feature を選択したときに色を変える

SelectFeature Control for Select and Highlight(highlight-feature.html) を参考に Feature を選択したときに色を変えます。

HTML ファイルを新規作成します。
「openlayersTokyoproj」 を右クリックして 新規 -> HTML ファイル をクリック。
「HTML ファイル」ウィンドウの「ファイル名(任意:openlayers_selecthighlight.html)」に入力して「完了」ボタンをクリック。
「charset」を「utf-8」にします。
「examples」の「highlight-feature.html」の内容をコピーして新規作成したファイルに貼り付けます。

次の様にコードを修正します。
(範囲を東京都の地図に合わせてみました。)

<html xmlns="http://www.w3.org/1999/xhtml">
<head>
<meta http-equiv="Content-Type" content="text/html; charset=utf-8" />
<title>SelectFeature Control for Select and Highlight</title>
<link rel="stylesheet" href="./theme/default/style.css" type="text/css" />
<link rel="stylesheet" href="./examples/style.css" type="text/css" />
<style type="text/css">
#controlToggle li {
list-style: none;
}
</style>
<script src="./lib/Firebug/firebug.js"></script>
<script src="./lib/OpenLayers.js"></script>

<script type="text/javascript" src="./lib/proj4js/lib/proj4js-compressed.js"></script>
<script type="text/javascript" src="./lib/proj4js/lib/projCode/tmerc.js"></script>
<script type="text/javascript" src="./lib/proj4js/lib/defs/EPSG2456.js"></script>

<!-- コードの修正 -->

<script type="text/javascript">
var map, controls;

OpenLayers.Feature.Vector.style['default']['strokeWidth'] = '2';

function init(){
// map = new OpenLayers.Map('map');
map = new OpenLayers.Map('map', {
projection: new OpenLayers.Projection("EPSG:2456"),
displayProjection: new OpenLayers.Projection("EPSG:4326"),
maxResolution: 'auto',
units: 'meters',
maxExtent: new OpenLayers.Bounds(-279000,1054000,-185000,1104000)
});

var vectors = new OpenLayers.Layer.Vector("vector", {isBaseLayer: true});
map.addLayers([vectors]);

// 追加 投影法の変換

var displayProj = new OpenLayers.Projection("EPSG:4326");

var polygon = new OpenLayers.Geometry.fromWKT("POLYGON((139.0 35.5, 139.381 35.9, 139.548 35.697, 139.0 35.5))");
polygon.transform(displayProj, map.getProjectionObject());

var feature = new OpenLayers.Feature.Vector(
OpenLayers.Geometry.fromWKT(
polygon
// "POLYGON((139.0 35.5, 139.381 35.9, 139.548 35.697, 139.0 35.5))"
)
);
vectors.addFeatures([feature]);

var polygon2 = new OpenLayers.Geometry.fromWKT("POLYGON((139.540 35.540, 139.880 35.795, 139.774 35.564, 139.540 35.540))");
polygon2.transform(displayProj, map.getProjectionObject());

var feature2 = new OpenLayers.Feature.Vector(
OpenLayers.Geometry.fromWKT(
polygon2
// "POLYGON((139.540 35.540, 139.880 35.795, 139.774 35.564, 139.540 35.540))"
)
);
vectors.addFeatures([feature2]);

// Feature にポイントを重ねたときの動作

var report = function(e) {
OpenLayers.Console.log(e.type, e.feature.id);
};

var highlightCtrl = new OpenLayers.Control.SelectFeature(vectors, {
hover: true,
highlightOnly: true,
renderIntent: "temporary",
eventListeners: {
beforefeaturehighlighted: report,
featurehighlighted: report,
featureunhighlighted: report
}
});

// Feature をクリックしたときの動作

var selectCtrl = new OpenLayers.Control.SelectFeature(vectors,
{clickout: true}
);

map.addControl(highlightCtrl);
map.addControl(selectCtrl);

highlightCtrl.activate();
selectCtrl.activate();

map.addControl(new OpenLayers.Control.EditingToolbar(vectors));
map.addControl(new OpenLayers.Control.MousePosition());
map.addControl(new OpenLayers.Control.ScaleLine());

if (!map.getCenter()) {
map.zoomToMaxExtent()
};
}
</script>
</head>

<!-- body タグ部分 -->

<body onload="init()">
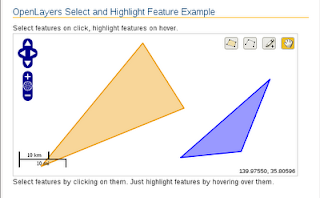
<h1 id="title">OpenLayers Select and Highlight Feature Example</h1>
<p id="shortdesc">
Select features on click, highlight features on hover.
</p>
<div id="map" class="smallmap"></div>
<p>Select features by clicking on them. Just highlight features by hovering over them.</p>
</body>
</html>

フィーチャにポインタを重ねたとき

フィーチャをクリックしたとき

2009年11月11日水曜日

OpenLayers 24e OpenLayers の XMLデータ処理

前回の Jugl Template Library で GMLデータを処理する前に、見当違いで XMLデータの処理をテストしていました。

XML データ処理を試す前に OpenLayers.loadURL をみてみます。

Ajax の HTTP 通信に Internet Explorer では ActiveXObject("Msxml2.XMLHTTP") をそれ以外のブラウザでは XMLHttpRequest() を使用します。
この2つのオブジェクトを仮に oj とすれば open メソッドを使い、次のようにファイルをロードします。

oj.open("GET", "./test.xml", true);

"GET" には、"GET" または "POST" が入り、ファイルに直接パラメータを追加します。

oj.open("GET", "./test.xml?sort=faverit", true);

"POST" では send() メソッドに引数を渡します。

oj.open("POST", "./test.xml", true);
request.send("sort=favorite");

"./test.xml" はファイルの場所。
true は、非同期/同期の設定で、true または省略で非同期です。

全体は,例えば次のようになります。

<!DOCTYPE html PUBLIC "-//W3C//DTD XHTML 1.0 Strict//EN"
"http://www.w3.org/TR/2000/REC-xhtml1-20000126/DTD/xhtml1-strict.dtd">
<html xmlns="http://www.w3.org/1999/xhtml">
<head>
<meta http-equiv="Content-Type" content="text/html; charset=utf-8">
<title>XML Load Test</title>
<script src="./trunk/build/jugl.js"></script>
</head>
<body>

<!-- XML処理マークアップ6 -->

<h2>JavaScript の XML処理</h2>
<div id="loadStatus">loading..</div>
<br />
<div id="template_id6">
<div jugl:content="node"></div>

<!-- HTTPRequest -->

<script type="text/javascript">
var res, oj, node;
function createHttpRequest() {
if (window.ActiveXObject) {
try {
return new ActiveXObject("Msxml2.XMLHTTP");
}
catch (e) {
return null
}
}
else if (window.XMLHttpRequest) {
return new XMLHttpRequest();
}
else {
return null
}
}

var oj = createHttpRequest();

// XML ファイルの読み込みと処理

oj.open("GET", "./jugl_flickr.xml", true);
oj.send(null);
oj.onreadystatechange = function(){
if (oj.readyState == 4 && oj.status == 200) {
updateStatus("loaded");
on_loaded(oj);
}
else {
updateStatus("unloaded");
}
}


function on_loaded(oj){
res = oj.responseXML;
node = res.documentElement.nodeName;
(new jugl.Template("template_id6")).process();
}

function updateStatus(msg) {
document.getElementById("loadStatus").firstChild.nodeValue = msg;
}
</script>
</body>
</html>

OpenLayers では次のようになります。(詳細はオンラインドキュメントをみてください。)

var url = "./test.xml";
OpenLayers.loadURL(url, null, null, onSuccessFunc, onFailureFunc);

1番目(url) は、ファイルの場所。
2番目(null)は、GET パラメータ(上記の GET と同じ)。
3番目(null)は、コールバック関数を渡したオブジェクト。
4番目(onSuccessFunc)は、ロード成功時のコールバック関数。
5番目(onSuccessFunc)は、ロード失敗時のコールバック関数。

です。

jugl_test.html に次のように追加します。

---
<!-- 「jugl:attributes を使うマークアップ4」 の直後-->
<h2>OpenLayers の XML処理</h2>
<!-- XML処理マークアップ5 -->
<div id="loadStatus2">loading..</div>
<br />
<div id="template_id5">
<div jugl:content="string"></div>
</div>

<script type="text/javascript">
//<![CDATA[
// 処理コード4
---
// 「処理コード4」の直後
// 処理コード5
var string;
var format2 = new OpenLayers.Format.XML();
var doc = null;

function loadSuccess2(request) {
updateStatus2("loaded");
if(!request.responseXML.documentElement) {
doc = format2.read(request.responseText);
} else {
doc = request.responseXML;
}
string = doc.documentElement.nodeName;
(new jugl.Template("template_id5")).process();
}

function updateStatus2(msg2) {
document.getElementById("loadStatus2").firstChild.nodeValue = msg2;
}
//]]></script>


次のコードはルートノードの名前を表示します。

string = doc.documentElement.nodeName;

結果は、

OpenLayers の XML処理
loaded
wfs:FeatureCollection

通常の Ajax の処理でも(当然ですが)同じ結果になります。

Jugl を試しているときに、次のコードでノードプロパティが表示されることを見つけました。
マークアップ(HTML)部分を

<div jugl:repeat="item node">
<div jugl:content="item + ': ' + node[item]"></div>
</div>

として、string = doc.documentElement.nodeName; を次のコードに換えます。

string = doc.documentElement;

結果は、

nodeName: wfs:FeatureCollection
tagName: wfs:FeatureCollection
getElementsByTagNameNS: function getElementsByTagNameNS() { [native code] }
firstChild: [object Text]
nodeType: 1
childNodes: [object NodeList]
---

これはルートノードのプロパティです。


OpenLayers の examples の XML Parsing Example(xml.html)で OpenLayers の XMLデータ処理をしています。
そこで使われているものがここのプロパティ一覧にあります。


string = doc.documentElement; を次のコードに換えます。

string = doc.documentElement.childNodes;

結果は、

0: [object Text]
1: [object Element]
2: [object Text]
3: [object Element]
4: [object Text]
length: 5
item: function item() { [native code] }

子ノードの数(length doc.documentElement.childNodes.lemgthの結果と同じ)が5個になります。
item とあるので次の様にして結果をみてみます。

string = doc.documentElement.childNodes.itme(0);

結果は、(nodeName だけ)

itme(0): nodeName: #text
itme(1): nodeName: gml:featureMember
itme(2): nodeName: #text
itme(3): nodeName: gml:featureMember
itme(4): nodeName: #text

コードを次の様に換えて結果をみます。

string = doc.documentElement.childNodes.itme(0).childNodes;


item(偶数) の結果は、

length: 0
item: function item() { [native code] }

で中身はありません。


item(奇数) の結果は、

0: [object Element]
length: 1
item: function item() { [native code] }

で、さらに次のコードに換えて結果をみます。

string = doc.documentElement.childNodes.itme(1).childNodes.itme(0);

結果は、

nodeName: fs:flickr
---(以下省略)

で、さらに次のコードに換えて結果をみます。

string = doc.documentElement.childNodes.itme(1).childNodes.itme(0).childNodes;

結果は、

0: [object Text]
1: [object Element]
2: [object Text]
3: [object Element]
---
length: 33
item: function item() { [native code] }

コードを次の様に換えて結果をみます。
上記の結果の奇数だけ確かめます。

string = doc.documentElement.childNodes.item(1).childNodes.item(0).childNodes.item(1);

結果は、(nodeName だけ)

itme(1): nodeName: fs:geometry
itme(3): nodeName: fs:isfamily
---
itme(9): nodeName: fs:title
---
itme(25): nodeName: fs:img_url
---

で、各ノードのプロパティに textContent とあるのでつぎのようにコードを換えると

マークアップ部分

<div jugl:content="string"></div>

string = doc.documentElement.childNodes.item(1).childNodes.item(0).childNodes.item(1).textContent;

itme(1).textContent: 139.77701,35.713345
itme(3),textContent: 0
---
itme(11).textContent: near Uenokouen
---
itme(25).textContent: http://farm3.static.flickr.com/2626/4052485410_519b430129_m.jpg
---

になります。